On this page:
About the report
Use this report for an in-depth view of a student's performance on a completed Reading Assistant Plus selection. Students who consistently work on the Reading Assistant Plus selections while maintaining a high level of performance typically gain the most benefit from the component.
To view a individual student's overall performance, or to view performance for a selection still in progress, see the Student Report – Reading Assistant Plus Implementation report.
This report shows results for students who used the component within the selected date range.
The results in this report reflect completed selections only. To learn more see Completing selections. The first part of the report only shows results for the first completion of a selection (results from any additional activity are excluded), while the last part of the report includes any additional activity. See each section for details.
While viewing the report, use the Current Reading Selection menu at the top of the report to choose another selection. A student must complete a selection at least one time for that selection to appear in this report (see Completing selections for more information).
This report is an expansion of the Student Reading Selections table on the student's Implementation Success report. It provides a more detailed look at the student's performance for each completed selection in that table, and includes all of the student's activity in those selections. To change the view to show results for other completed selections, you'll need to change the date range on the Implementation Success report:
- Click the Back link at the top of the Selection Report to return to the student's Implementation Success report.
- Change the date range to include dates in which the student worked on the selections you'd like to view (see About report date ranges for help).
- The Reading Selections table will update to include those selections.
- Click a selection title in the Reading Selection column to open the report for that selection.
- Continue navigating the report as usual.
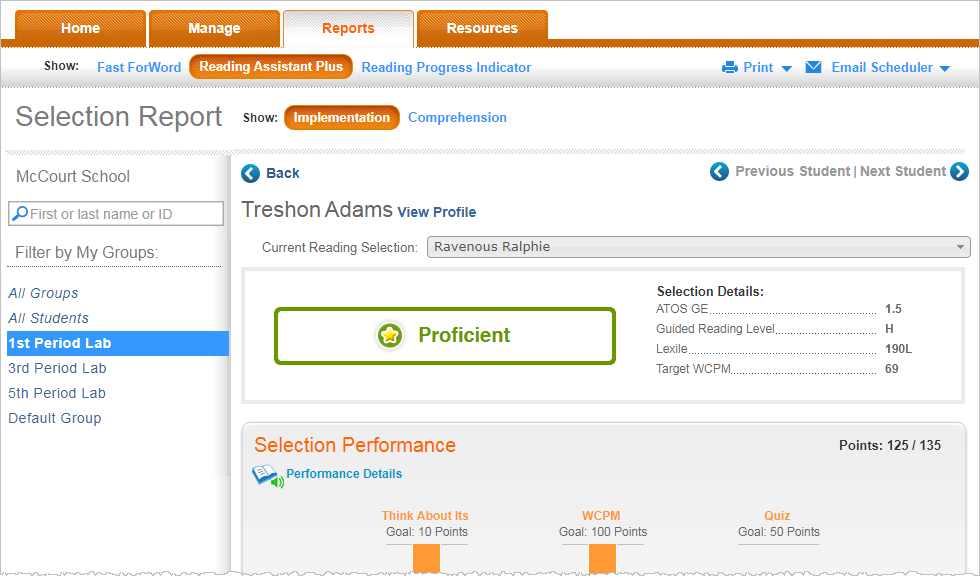
Selection rating and details
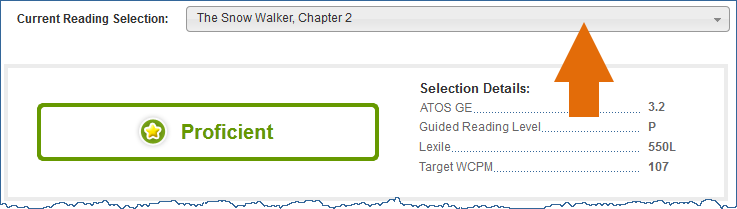
This section at the top of the report rates the student's performance in the selection, and shows the selection's reading level details. This information allows you identify how well the student is performing at a specific reading level.
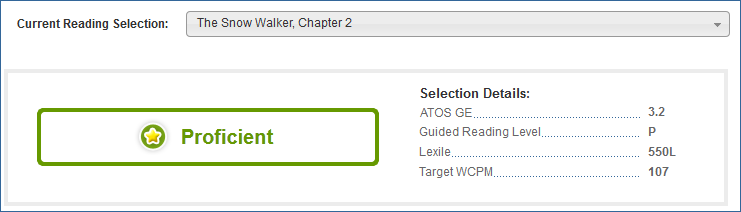
Performance level score. On the left, the report rates the student’s performance in the selection. The three possible performance level scores correlate to the achievement markers in the student's Selection Report inside Reading Assistant Plus: gold star, silver star, and check mark. See Performance Levels for more information on interpreting the score.
![]() Proficient (gold star)
Proficient (gold star)
![]() Developing (silver star)
Developing (silver star)
![]() Emerging (check mark)
Emerging (check mark)
Selection Details. The right side of the report shows how the selection maps to three widely-adopted leveling systems. For more information see About Reading Assistant Plus content design. The bottom of this list shows the fluency goal for the selection. Note that a value of NP means that the selection is non-prose and could not be leveled by this system.
ATOS GE. From ATOS. mySciLEARN uses this grade equivalent to calculate the student's Reading Level High Score.
Guided Reading Level. From Fountas and Pinnell.
Lexile. From the Lexile® Framework for Reading.
Target WCPM. The target words correct per minute (WCPM) for the Read and Record activity, which represents the expected fluency score for a reading of the selection.
Selection Performance graph
This bar graph illustrates how well the student performed within each activity based on the points earned in that activity, similar to the student's Selection Report inside Reading Assistant Plus. With Reading Assistant Plus, points correlate directly to performance; that is, a higher points score reflects a better performance. Each activity in the selection shows a bar graph that illustrates the points earned in the first completion of that activity. The total number of points available for each activity appears at the top of each bar (Goal). In addition, each bar is divided into five sections, with each section representing 20% of the points goals for that activity. To view the actual points earned in the activity, along with the performance in the activity, hold your cursor over that bar.
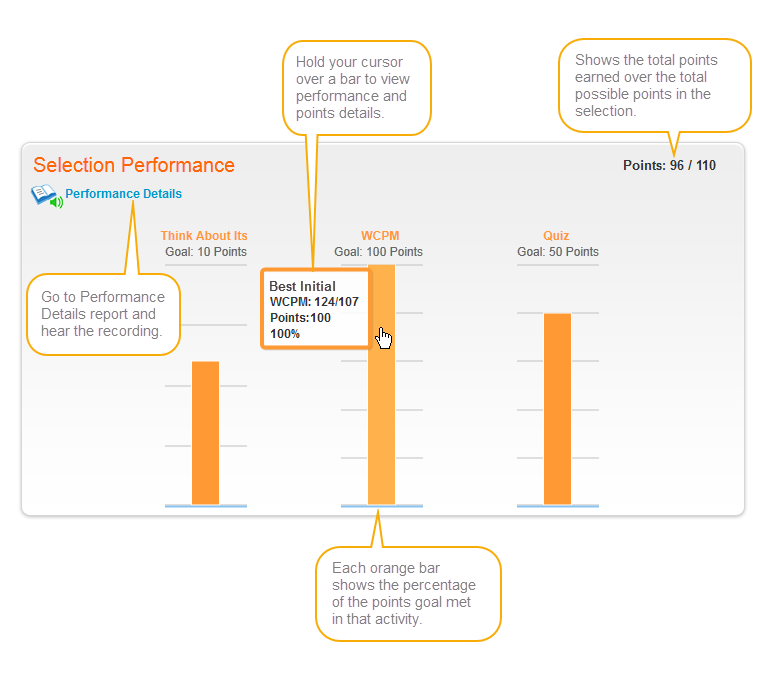
Performance Details link. If the selection has an available audio recording, you can click this link in the upper left corner of the graph to open the Performance Details for the selection, where you can listen to the student's latest recording, view the selection text, see a list of words to practice, and review the student's actual questions and responses for the Think About Its and the quiz. For more information see Student Report – Reading Assistant Plus Performance Details. Note that if the selection does not have an audio recording available for a selection, you can still access the Performance Details for that selection from the student's Student Report – Reading Assistant Plus Implementation report.
Points. The upper right corner shows the points earned in the first completion of the selection, out of the total possible points available in the selection.
Think About Its. This bar maps the number of points earned in the first attempt at the Think About It questions and tasks in the Preview and Read activity, which use comprehension strategies and hints to scaffold comprehension.
Words Correct per Minute. This bar maps the number of points earned from the best initial reading in the Read and Record activity, which assesses the student's ability to read aloud with ease and accuracy while focusing attention on the meaning and message of the text.
Quiz. This bar maps the number of points earned in the first attempt at the Take the Quiz activity, which assesses the student's comprehension of the selection while evaluating comprehension skills and levels of thinking.
Time Usage Per Activity chart
This chart illustrates how the student is dividing his or her time among the three main activities in the selection (the inner pie chart), and then breaks down that time for the tasks within each activity (the outer donut chart). It includes all of the time spent in the activities, including additional time spent after completion.
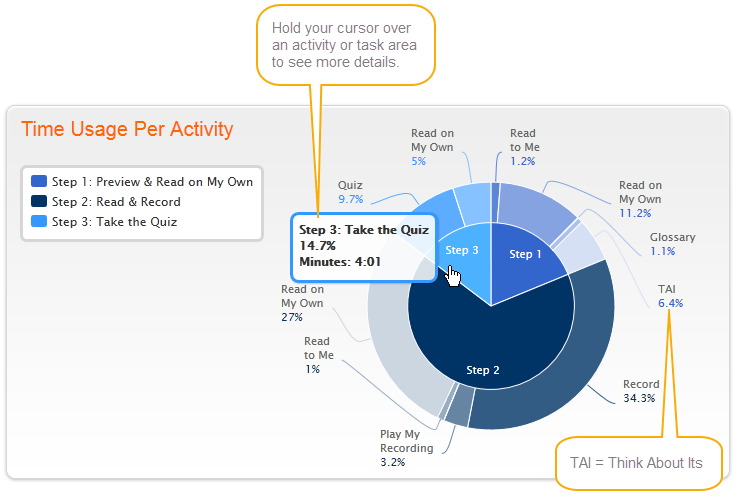
![]() Step 1: Preview and Read. Maps the total percentage of time the student spent in the first activity, and then breaks down that percentage for each task in the activity:
Step 1: Preview and Read. Maps the total percentage of time the student spent in the first activity, and then breaks down that percentage for each task in the activity:
![]() Read to Me. Maps the percentage of time spent listening to a model fluent reading of the selection.
Read to Me. Maps the percentage of time spent listening to a model fluent reading of the selection.
![]() Read on My Own. Maps the percentage of time spent reading silently at their own pace.
Read on My Own. Maps the percentage of time spent reading silently at their own pace.
![]() Glossary. Maps the percentage of time spent reviewing word definitions in the glossary.
Glossary. Maps the percentage of time spent reviewing word definitions in the glossary.
![]() TAI (Think About It). Maps the percentage of time spent working on Think About Its (questions and tasks designed to scaffold comprehension).
TAI (Think About It). Maps the percentage of time spent working on Think About Its (questions and tasks designed to scaffold comprehension).
![]() Step 2: Read and Record. Maps the total percentage of time the student spent in the second activity, and then breaks down that percentage for each task in this activity. In general, students should be spending most of their time in this activity.
Step 2: Read and Record. Maps the total percentage of time the student spent in the second activity, and then breaks down that percentage for each task in this activity. In general, students should be spending most of their time in this activity.
![]() Record. Maps the percentage of time spent reading the selection aloud. In general, students should be spending most of their time in this task.
Record. Maps the percentage of time spent reading the selection aloud. In general, students should be spending most of their time in this task.
![]() Play My Recording. Maps the percentage of time spent listening to a recorded reading.
Play My Recording. Maps the percentage of time spent listening to a recorded reading.
![]() Read to Me. Maps the percentage of time spent listening to a model fluent reading of the selection.
Read to Me. Maps the percentage of time spent listening to a model fluent reading of the selection.
![]() Read on My Own. Maps the percentage of time spent reading silently at their own pace.
Read on My Own. Maps the percentage of time spent reading silently at their own pace.
![]() Step 3: Take the Quiz. Maps the total percentage of time the student spent in the third activity, and then breaks down that percentage for each task in the activity:
Step 3: Take the Quiz. Maps the total percentage of time the student spent in the third activity, and then breaks down that percentage for each task in the activity:
![]() Quiz. Maps the percentage of time spent answering quiz questions.
Quiz. Maps the percentage of time spent answering quiz questions.
![]() Read on My Own. Maps the percentage of time spent scrolling through the selection to review the text as needed to help answer the quiz questions.
Read on My Own. Maps the percentage of time spent scrolling through the selection to review the text as needed to help answer the quiz questions.
More about Time Usage Per Activity chart
This table does not include time spent in other tasks (the Word Wall activity, browsing the library, or viewing the points and student reports). For that information see Student Report – Reading Assistant Plus Implementation.
The time usage data in this chart is cumulative; that is, if the student revisits any part of an activity in the selection, that usage will be added to the chart. To view the percentage of time and the number of minutes spent in an activity or task, hold your cursor over that area of the chart.
This chart may not accurately reflect usage for students who are using unlocked content progression mode (unlocked mode is designed for teachers only and does not enforce actual student usage within the activities). See Content progression for more information on unlocked mode.
Time Usage (Minutes) table
This table shows how much time the student spent working on the three main activities in the selection. It includes all of the time spent in the activities, including additional time spent after completion.
The time for each activity appears in an individual row in the table, with the other fields showing a dash; however, you may occasionally see two or more activities in the same row. This grouping lets you easily view repeated activities; for example, the second reading of a selection or a retaking of the quiz.
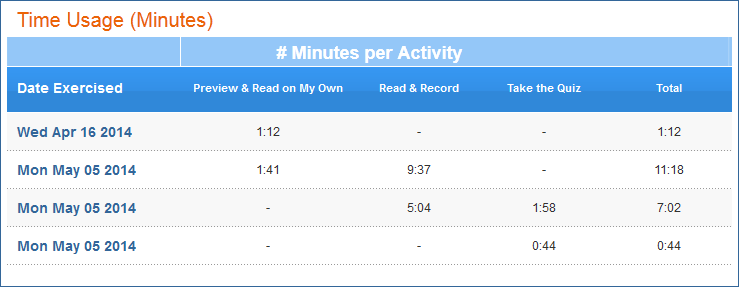
Date Exercised. This column shows the dates that the student worked on an activity in the selection. Click the header to sort the report by this column. If the student worked on more than one activity on the same day, those rows will show the same date.
Preview and Read. This column shows how much time the student spent in the first activity, which might include listening to a reading, reading the text, using the glossary, and responding to the Think About Its.
Read and Record. This column shows how much time the student spent in the second activity, which might include recording and listening to recordings, listening to a reading, and reviewing the text. In general, students should be spending most of their time in this activity.
Take the Quiz. This column shows how much time the student spent in the third activity, which might include answering quiz questions and reviewing the text.
Total. This column shows the total time spent in the three main activities.
More about Time Usage (Minutes) table
This table does not include time spent in other tasks (the Word Wall activity, browsing the library, or viewing the points and student reports). For that information see Student Report – Reading Assistant Plus Implementation.
If the student revisits any activity in the selection, the table will be updated to include those results.
This table may not accurately reflect usage for students who are using unlocked content progression mode (this mode is designed for teachers only and does not enforce actual student usage within the activities). See Content progression for more information on unlocked mode.
Scores table
This table shows the student's scores for each individual activity in the selection. It includes all results for each activity, including additional results from work done after completion. The scores for each activity appear in an individual row in the table, with the other fields showing a dash; however, you may occasionally see two or more activities in the same row. This grouping lets you easily view activities for repeated selections; for example, the second reading of a selection or a retaking of the quiz.
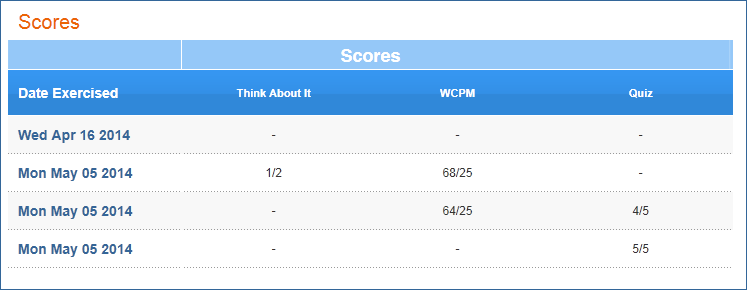
Date Exercised. This column shows the dates that the student worked on an activity in the selection. Click the header to sort the report by this column. If the student worked on more than one activity on the same day, those rows will show the same date.
Think About It. This column shows the student's first responses to the Think About It questions and tasks in the Preview and Read activity, which use comprehension strategies and include hints to scaffold comprehension. Includes the number of correct responses out of the total number of Think About Its in the selection.
WCPM. This column shows the student's performance for each completed reading in the Read and Record activity, which indicates the student's fluency skills. Shows the words correct per minute (WCPM) score over the WCPM goal for the selection.
Quiz. This column shows the student's performance for each completed quiz in the Take the Quiz activity, which indicates the student's comprehension skills. Shows the number of correct answers over the total number of questions in the quiz.
More about Scores table
If the student revisits either of the last two activities in the selection, the table will be updated to include those results.
When comparing this table to the Time Usage (Minutes) table, you may notice an empty row in this table, even though the Time Usage table shows time spent in the activity. This is not unusual; for example, a student could spend time reading the text and looking at the glossary in the Preview and Read activity without responding to any of the Think About Its, and therefore not have a score to display.