On this page:
About the report
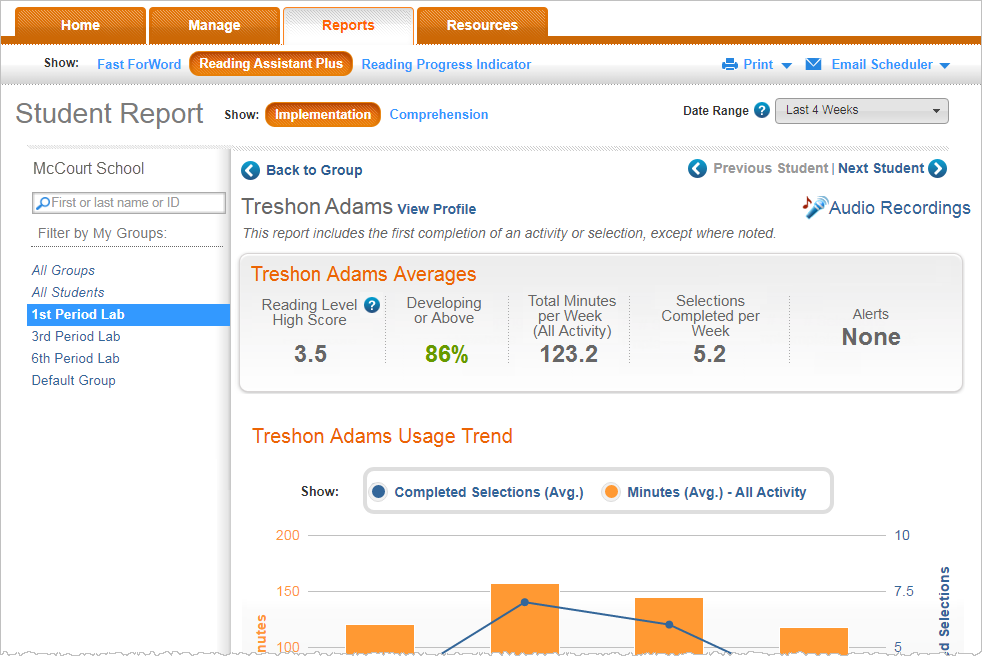
Use this report to learn how well a student is meeting your implementation and achievement goals for Reading Assistant Plus by checking student performance at the selection level and the task/skill level. Students who consistently use the Reading Assistant Plus software and progress through content while maintaining a high level of performance typically gain the most benefit from the component.
For an in-depth view of a student's performance in an individual selection, see the Selection Report – Reading Assistant Plus.
This report shows results for students who used the component within the selected date range.
Except where noted, the results in this report reflect completed selections only, and only the first completion of a selection (results from any repeats are excluded). To learn more see Completing selections.
Throughout the report, mySciLEARN uses specific benchmarks and guidelines to indicate student achievement in Reading Assistant Plus. To learn more see About Reading Assistant Plus report scores.
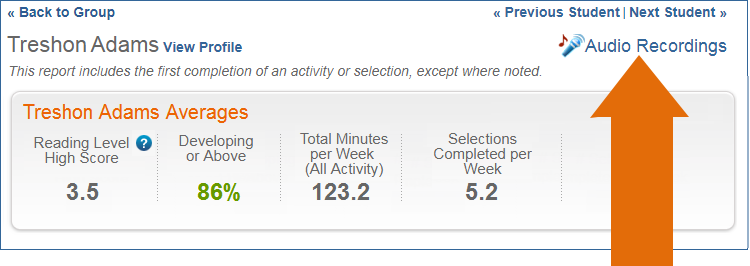
Audio Recordings link
Use the Audio Recordings link in the upper right corner of the report to access the student's Audio Recordings page, where you can listen to recorded readings, review performance details, and manage the student's recording portfolio. To learn more see Student Report – Reading Assistant Plus Audio Recordings & Portfolio. If the Audio Recordings link does not appear on this report, the student does not have any recordings (the student hasn't completed any selections yet or doesn't have any saved recordings).
Student Averages chart
This chart provides a summary of how well the student met Reading Assistant Plus performance and implementation expectations for the selected date range. The selection performance metrics—Reading Level High Score and Developing or Above—measure actual Reading Assistant Plus achievement. The component use information—minutes per week and selections per week—allows you to quickly measure implementation success.
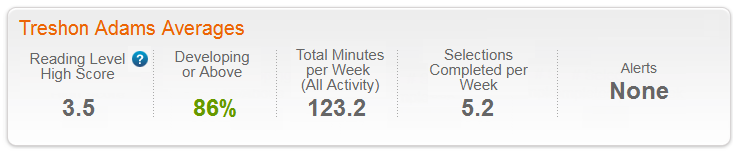
Reading Level High Score. The Reading Level High Score for the student (to learn more see Reading Level High Score). If the student has not earned a Reading Level High Score, this field shows N/A.
Developing or Above. The percentage of selections completed at a performance level of developing or proficient. mySciLEARN uses colors to rate this percentage as excellent (green), good (blue), or needs improvement (red). To learn more see Developing or Above.
Total Minutes per Week (All Activity). The average number of minutes per week the student spent working on Reading Assistant Plus, including time spent repeating selections, and selections that are still in progress. Students who spend the expected amount of time using the software each week—as prescribed by either the Reading Assistant Plus schedules or by your own classroom schedule—are more likely to improve their performance and achieve success.
Selections Completed per Week. The average number of selections per week completed by the student. Students who consistently complete content each week have a greater chance of improving their performance and achieving success. To learn more see Completing selections.
Alerts. The current alerts for a student. If you see an alert icon ![]() , click it for detailed recommendations. To learn more see About report status updates and alerts.
, click it for detailed recommendations. To learn more see About report status updates and alerts.
Student Usage Trend graph
This graph illustrates how well the student is meeting your implementation goals for each week in the date range. Reviewing these results over multiple weeks can help you identify component usage trends and—if needed—take corrective action, such as monitoring student usage in the classroom or providing incentives to increase productivity.
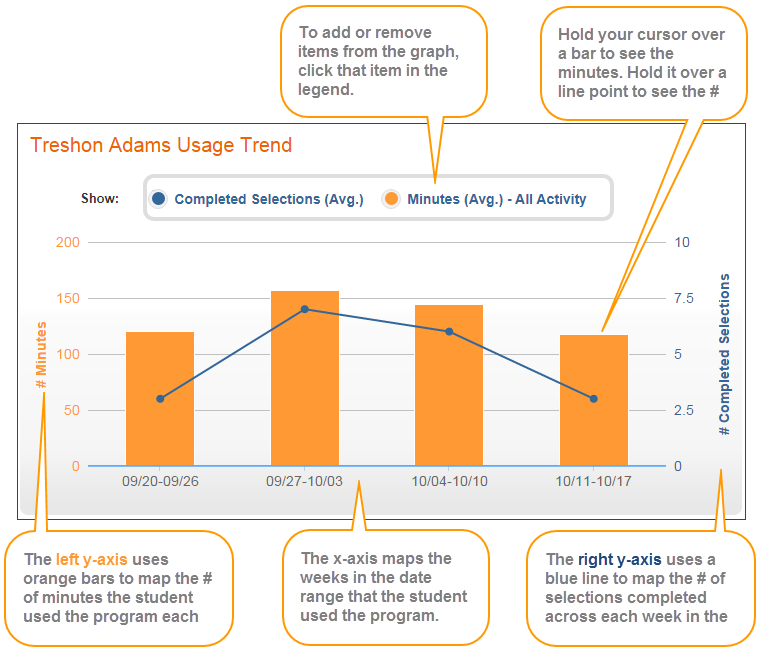
X-axis. Maps the weeks in the date range that the student used Reading Assistant Plus. If the student did not train during a week, that week does not appear in the graph.
Y-axis. Maps two related usage trends for the student:
-
 Minutes - All Activity. The orange bars show the number of minutes per week the student spent working on Reading Assistant Plus, including time spent repeating selections, and selections that are still in progress. One bar appears for each week. The reference scale appears on the left side of the graph, in orange.
 -
 Completed Selections. The blue dots show the number of selections completed each week, connected by a blue line across the weeks in the graph. The reference scale appears on the right side of the graph, in blue.
By default, the graph shows everything. You can filter information in the graph by clicking an item in the legend at the top of the graph. Hold your cursor over an item in the graph to view the actual minutes or selections, broken down by completed selections and repeated selections.
Student Time Usage per Session - All Activity chart
This pie chart illustrates, on average, how the student is dividing his or her time across the activities in a Reading Assistant Plus session. This average is taken from all sessions in the date range, and includes all of the time spent in the activities, regardless of selection completion status.
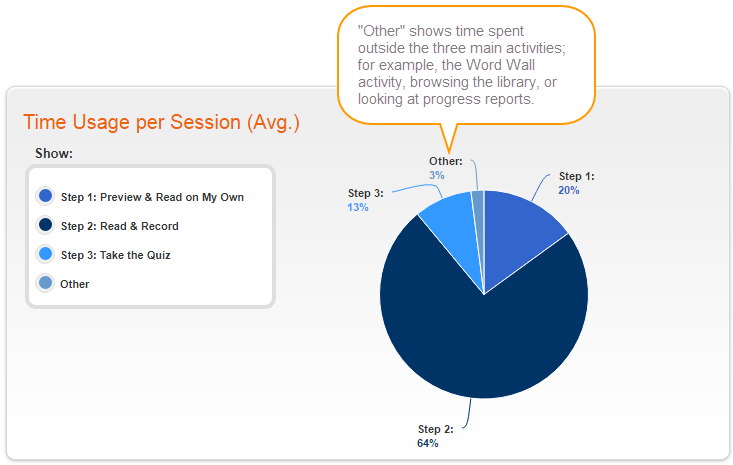
To view the actual number of minutes spent in an activity, hold your cursor over that section in the chart.
![]() Step 1: Preview and Read. Maps the average percentage of time the student spent in the first activity each session, which includes using the glossary, listening to a reading, reading the text, and responding to the Think About Its.
Step 1: Preview and Read. Maps the average percentage of time the student spent in the first activity each session, which includes using the glossary, listening to a reading, reading the text, and responding to the Think About Its.
![]() Step 2: Read and Record. Maps the average percentage time the student spent in the second activity each session, which includes recording and listening to recordings, listening to a reading, and reviewing the text. In general, students should be spending most of their time in this activity.
Step 2: Read and Record. Maps the average percentage time the student spent in the second activity each session, which includes recording and listening to recordings, listening to a reading, and reviewing the text. In general, students should be spending most of their time in this activity.
![]() Step 3: Take the Quiz. Maps the average percentage of time the student spent in the third activity each session, which includes answering quiz questions and reviewing the text.
Step 3: Take the Quiz. Maps the average percentage of time the student spent in the third activity each session, which includes answering quiz questions and reviewing the text.
![]() Other. Maps the average percentage of time the student spent outside the three activities, which includes the Word Wall activity, browsing the library, or viewing the points and student reports. Students should not show too much time here, but if so, you may want to investigate why. It’s possible that the student needs additional vocabulary instruction for the Word Wall activity, or more guidance or supervision while using the component.
Other. Maps the average percentage of time the student spent outside the three activities, which includes the Word Wall activity, browsing the library, or viewing the points and student reports. Students should not show too much time here, but if so, you may want to investigate why. It’s possible that the student needs additional vocabulary instruction for the Word Wall activity, or more guidance or supervision while using the component.
Note: This report may not accurately reflect usage for students who are using unlocked content progression mode (this mode is designed for teachers only and does not enforce actual student usage within the activities). See Content progression for more information on unlocked mode.
Student Time Usage - All Activity table
This table breaks down usage for each Reading Assistant Plus training session in the date range. Each session appears in an individual row in the table, with the most recent session first.
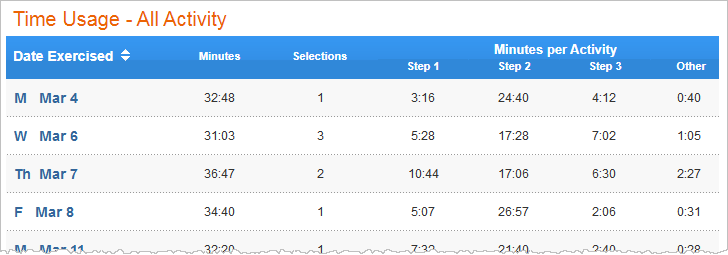
This table includes results for the days that the student used Reading Assistant Plus. It includes the following columns. Click a column header to sort the report.
Date Exercised. The weekday, the month, and the day of the session; for example: Mon Mar 21
Minutes. The total amount of time the student spent in that session, in minutes and seconds. This value represents the time spent in all of the selection activities, regardless of completion status.
Selections. The number of selections the student completed in that session. To learn more see Completing selections. If the student did not complete a selection, this field shows 0.
Minutes per Activity. This section breaks down usage by each individual selection activity, in minutes and seconds. If the student did not spend any time in an activity, that field shows a dash.
- Step 1. How much time the student spent in the first activity, which includes using the glossary, listening to a reading, reading the text, and responding to the Think About Its.
- Step 2. How much time the student spent in the second activity, which includes recording and listening to recordings, listening to a reading, and reviewing the text. In general, students should be spending most of their time in this activity.
- Step 3. How much time the student spent in the third activity, which includes answering quiz questions and reviewing the text.
- Other. How much time the student spent outside the three activities, which includes the Word Wall activity, browsing the library, or viewing the points and student reports. Students should not show too much time here, but if so, you may want to investigate why. It’s possible that the student needs additional vocabulary instruction for the Word Wall activity, or more guidance or supervision while using the component.
Note: This report may not accurately reflect usage for students who are using unlocked content progression mode (this mode is designed for teachers only and does not enforce actual student usage within the activities).
Student Performance and Reading Level Trend graph
Use this graph to view a student's selection performance for each week in the date range. Reviewing these results over time can help illustrate student progression trends and reading proficiency gains.
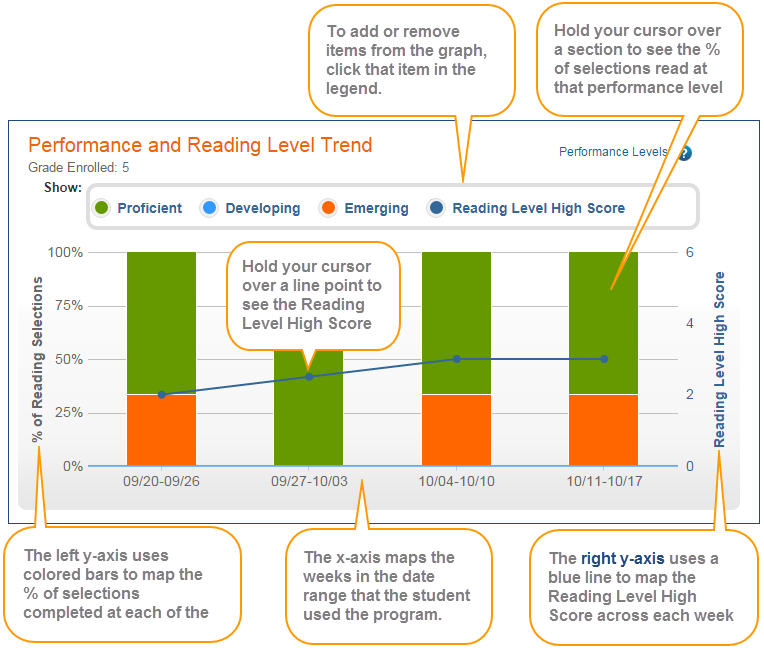
Grade Enrolled. The top of the graph lists the student's grade when he or she started working on Reading Assistant Plus.
X-axis. Maps the weeks in the date range that the student used Reading Assistant Plus. If the student did not train during a week, that week does not appear in the graph.
Y-axis. Maps two related performance trends for the student:
% of Reading Selections. The stacked orange, blue, and green bars show the percentage of selections completed at each performance level; that is, the percentage of selections completed at each of the levels. To learn more see Performance Levels. The reference scale appears on the left side of the graph.
![]() Proficient
Proficient
![]() Developing
Developing
![]() Emerging
Emerging
![]() Reading Level High Score. The blue dots show the number of selections completed each week, connected by a blue line across the weeks in the graph. The reference scale appears on the right side of the graph, in blue. Ideally, this graph should go up over time as the student reads increasingly difficult content and improves his or her scores. To learn more see Reading Level High Score. Note that if the student does not complete any selections during a week, the graph will not show a Reading Level High Score for that week.
Reading Level High Score. The blue dots show the number of selections completed each week, connected by a blue line across the weeks in the graph. The reference scale appears on the right side of the graph, in blue. Ideally, this graph should go up over time as the student reads increasingly difficult content and improves his or her scores. To learn more see Reading Level High Score. Note that if the student does not complete any selections during a week, the graph will not show a Reading Level High Score for that week.
By default, the graph shows everything. You can filter information in the graph by clicking an item in the legend at the top of the graph. To view the actual results in the graph, hold your cursor over that item in the graph. For example, if you hold your cursor over a section of a bar graph, you'll see the percentage of selections completed at that level that week and the number of selections completed at that level over the total selections completed at all levels that week.
Student Achievement graph
This graph illustrates a student's fluency and comprehension skills as measured by their performance in Reading Assistant Plus. for each week in the date range. Reviewing these results over time can help illustrate reading skill gains.
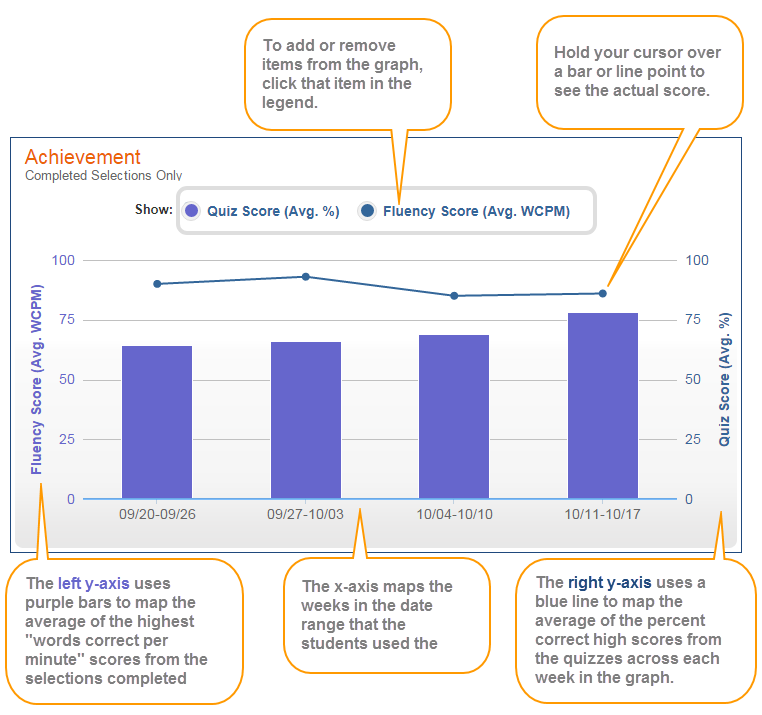
X-axis. Maps the weeks in the date range that the student used Reading Assistant Plus. If the student did not train during a week, that week does not appear in the graph.
Y-axis. Maps two related achievement scores:
![]() Fluency Score (Avg. WCPM). Each purple bar maps the average best initial words correct per minute score from the selections completed that week. This average only includes the best initial recording from each selection. Hold your cursor over a bar to see the average high score over the average goal for that week (for example, 82/94). The reference scale appears on the left side of the graph, in purple.
Fluency Score (Avg. WCPM). Each purple bar maps the average best initial words correct per minute score from the selections completed that week. This average only includes the best initial recording from each selection. Hold your cursor over a bar to see the average high score over the average goal for that week (for example, 82/94). The reference scale appears on the left side of the graph, in purple.
![]() Quiz Score (Avg. %). Each blue dot maps the average of the first comprehension score from the selections completed that week. This percent correct score is based on a scale of 0% to 100%. A score of 80% or higher indicates that the student has a good understanding of the skills worked on in the selections, while a score below 80% indicates that the student needs to work on these comprehension skills. Each score is connected by a blue line across the weeks in the graph to help illustrate progress over time. The reference scale appears on the right side of the graph, in blue.
Quiz Score (Avg. %). Each blue dot maps the average of the first comprehension score from the selections completed that week. This percent correct score is based on a scale of 0% to 100%. A score of 80% or higher indicates that the student has a good understanding of the skills worked on in the selections, while a score below 80% indicates that the student needs to work on these comprehension skills. Each score is connected by a blue line across the weeks in the graph to help illustrate progress over time. The reference scale appears on the right side of the graph, in blue.
By default, the graph shows everything. You can filter information in the graph by clicking an item in the legend at the top of the graph. Hold your cursor over an item in the graph to view the actual score.
Student Reading Selections table
This table provides performance and usage details for each of the selections worked on within the selected date range. Each selection appears in an individual row in the table, with the most recent selection first. To view detailed performance results for a selection, click a selection title to go to the Selection Report – Reading Assistant Plus.
The data in this table reflects the first completion of an activity, regardless of selection completion status. It includes the following columns. Click a column header to sort the report.
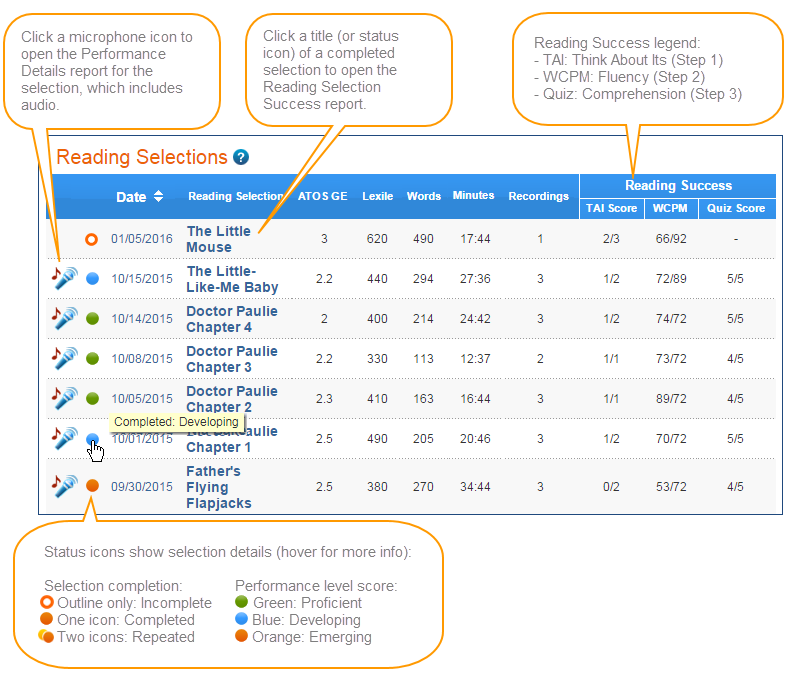
![]() . Click the microphone icon next to a selection to go the Performance Details for that selection, where you can listen to and download the latest recorded reading and review selection details for that recording. To learn more see Student Report – Reading Assistant Plus Performance Details. Note that selections without a microphone icon next to them do not have any recordings available (either the selection is not yet complete, or the recording is not in the student's recording list yet).
. Click the microphone icon next to a selection to go the Performance Details for that selection, where you can listen to and download the latest recorded reading and review selection details for that recording. To learn more see Student Report – Reading Assistant Plus Performance Details. Note that selections without a microphone icon next to them do not have any recordings available (either the selection is not yet complete, or the recording is not in the student's recording list yet).
Status icons. The status icons next to the date indicate the following selection results.
Selection completion. The status icons indicate selection completion status as follows. When the selection has been completed or repeated, click the status icon to go to the Selection Report – Reading Assistant Plus and see detailed results. To learn how students complete selections, see Completing selections.
![]() Incomplete
Incomplete
![]() Completed
Completed
![]() Repeated (note that the results in this table do not reflect any repeated content)
Repeated (note that the results in this table do not reflect any repeated content)
Performance level score. When the selection has been completed, the icon color indicates the student’s performance in the selection as follows. To learn more see Selection Report – Reading Assistant Plus.
![]() Proficient
Proficient
![]() Developing
Developing
![]() Emerging
Emerging
Date. The date that the student last worked on the selection.
Reading Selection. The selections the student worked on within the selected date range. When a selection has been completed, you can click the selection title to go to the Selection Report – Reading Assistant Plus and see performance results for the selection.
ATOS GE. The ATOS grade equivalent of the selection. The Reading Assistant Plus reports use this value when referring to the "reading level" of a selection. To learn more see About Reading Assistant Plus content design.
Lexile. The Lexile measure of the selection. To learn more see About Reading Assistant Plus content design.
Words. The total number of words in the selection.
Minutes. The total minutes spent completing the three activities in the selection. This excludes any “other” time spent in the component, such as browsing the library or working on the Word Wall activity.
Recordings. The number of times the student recorded a reading in the selection.
Grade Enrolled. The student's grade when he or she started working on Reading Assistant Plus.
Reading Success. This section of the table provides performance results for the selection. It includes the results from the first completion of each activity in a selection.
- TAI Score. The student's first responses to the Think About It questions and tasks in the Preview and Read activity, which use comprehension strategies and include hints to scaffold comprehension. Includes the number of correct responses out of the total number of Think About Its in the selection. If the student has not responded to all of the Think About Its in the selection, this field shows a dash.
- WCPM. The student’s best initial performance in the Record My Reading task in the Read and Record activity, which indicates the student's fluency skills. Shows the best words correct per minute (WCPM) score over the WCPM goal for that selection. See the Selection Report – Reading Assistant Plus for details on the fluency goal for a selection. If the student has not completed at least one reading in the selection, this field shows a dash.
- Quiz Score. The student's first responses to the quiz questions in the Take the Quiz activity, which indicates the student's comprehension skills. Shows the number of correct answers out of the total number of questions from that quiz. See the Selection Report – Reading Assistant Plus for details on the student's comprehension scores within a selection. If the student has not taken a quiz in the selection, this field shows a dash.