On this page:
About the report
Use this report to review a student's progress in the Fast ForWord exercises, along with a list of errors made by the student within each exercise.
This report shows results as follows:
- Exercise Progress graph includes all student activity, with the student activity for the days in the date range highlighted in blue.
- Student Averages chart includes student activity for the weeks in the date range.
- Progress table includes student activity for the weeks in the date range.
- Exercise Progress by Date includes all student activity, as long as the student trained at least one day within the date range.
- Progress Details includes all student activity, regardless of the date range.
- Errors include different ranges of student activity based on the component and the view.
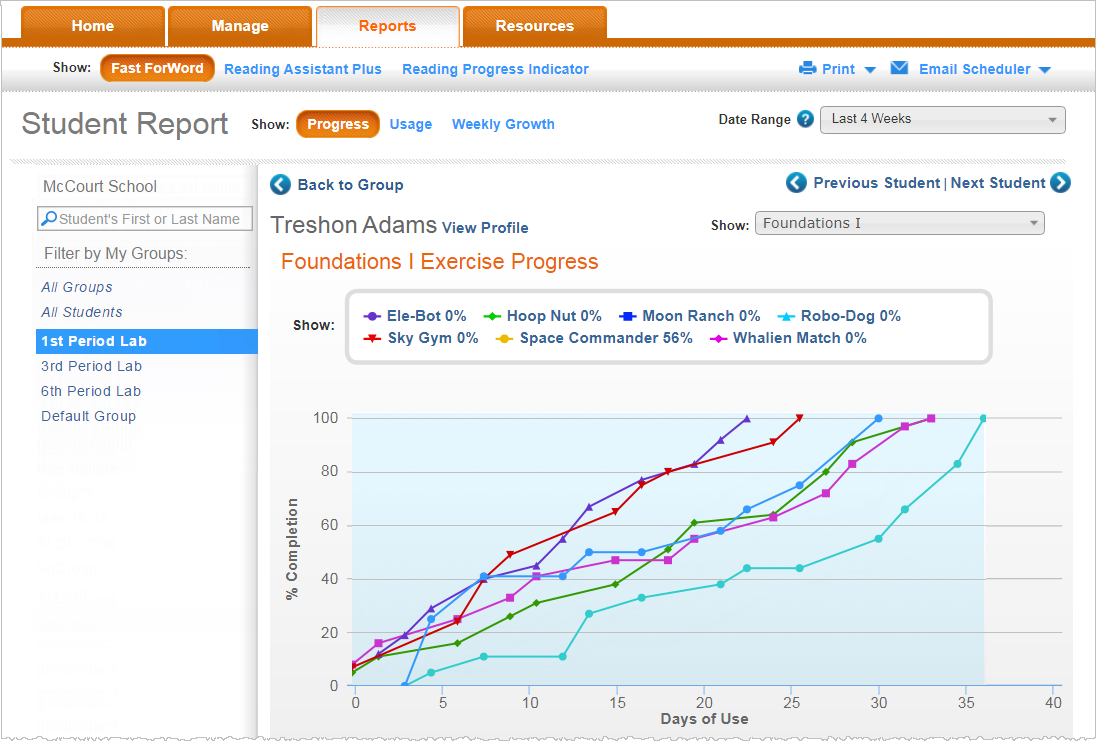
Exercise Progress graph
This graph visually tracks a student's progress within each exercise over time. Each graph maps the student's percent complete score in an exercise for each day of participation in that exercise. Additionally, the graphs in this report visually track a student's progress within an exercise over time, which can help determine a student's standing within an exercise or the Fast ForWord component as a whole.
- X-axis. Maps the participation days, or the number of days the student has worked on each exercise in the Fast ForWord component. This number does not necessarily correspond to calendar days; for example, weekends are not counted unless the student actually works on a Saturday or Sunday. The actual training days in an exercise are marked with a dot. The blue background highlights the data that falls within the date range (set at the top of the report).
- Y-axis. Maps the student's percent complete score. Each point corresponds directly to the scores in the Student Percent Complete History report, illustrating the student's progress within an exercise over time.
Each graph lists the current percent complete score next to the exercise name. This score, along with the exercise graph, is a high-water mark for the exercise. For example, if a student completes 36% of an exercise, then begins to do poorly and regresses in the exercise, the percent complete score continues to reflect that 36% of the exercise has been covered. If you look at the graph for this exercise, the highest point mapped will be 36%.
By default, the graph maps all exercises in the component. You can choose which exercises to include in the graph by choosing the exercise names (in blue) in the legend at the top of the graph.
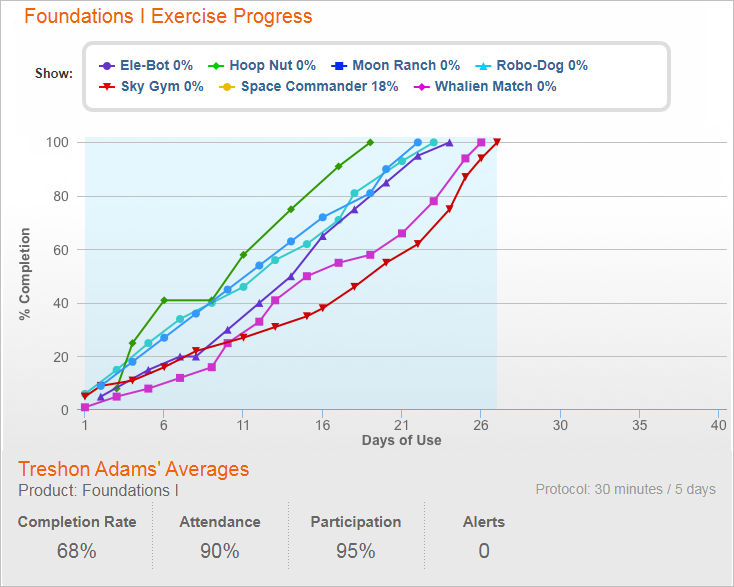
Student Averages. This chart below the Exercise Progress graph provides a summary of how well the student is meeting the Fast ForWord component achievement goals for the selected date range. Students who consistently earn high ratings and meet achievement goals typically gain the most benefit from the Scientific Learning components. The achievement scores—completion rate, attendance, and participation—measure Fast ForWord component implementation by comparing actual achievement against achievement goals.
- Completion Rate. Shows how quickly the student progressed through the component when he/she used it, relative to the expected completion rate. See Completion rate.
- Attendance. Shows how many days per week the student used the component, relative to the scheduled days per week. See Attendance.
- Participation. Shows how much time the student spent using the component, relative to the scheduled minutes per day. See Participation.
- Alerts. Shows the number of current intervention alerts for the student. An intervention alert indicates that a student requires immediate attention. Intervention alert details appear in the Progress table section of this report. Alerts are date sensitive, so you may see "N/A" in this field if your date range does not include the current date.
- Protocol. The upper right corner shows the protocol that the student used when working on the Fast ForWord component. Protocols provide specific training schedules for the student.If the student used more than one protocol within the selected date range, "Mixed" appears in this field.
Note: When calculating the student averages scores, if the date range is more than one week, the scores will represent an average of the total weeks in the date range. For example, if the date range is Last 4 Weeks, the scores will be an average of the last four weeks' scores. See About report date ranges.
Progress table
This table indicates the student's progress scores in the Fast ForWord component, along with a few other status details.
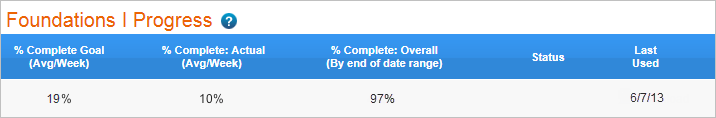
% Complete: Goal. Shows the percentage of the Fast ForWord component the student should complete this week. If the report date range is more than one week, this score is an average of the total weeks in the date range. For example, if the date range is Last 4 Weeks, the goal will be the average of the last four weeks' goals. Completion goals are unique for each Fast ForWord component and protocol, and typically vary week to week. Completion goals also expect that the student will complete the protocol each week.
% Complete: Actual. Shows the actual percentage of the Fast ForWord component the student completed this week. If the report date range is more than one week, this score is an average of the total weeks in the date range. For example, if the date range is Last 4 Weeks, the actual score will be the average of the last four weeks' actual scores.
% Complete: Overall. Displays the percent complete in the Fast ForWord component, from the start of the component to the end of the selected date range. To view a student's total percent complete in the component to date, change the date range for the report, or see Exercise Progress graph.
Status. Shows any current status updates and alerts for a student. An intervention alert indicates that the student requires immediate attention. If you see a status update or alert icon in this column, click it for detailed recommendations. Status updates and alerts are date sensitive, so this field may be blank if your date range does not include the current date.
![]() Switch
Switch
![]() Complete
Complete
![]() Intervene
Intervene
![]() Adjust
Adjust
Last Used. Shows the date of the student's last training session on the Fast ForWord component.
Exercise Progress by Date
This table provides an historical view of the student's percent complete scores for each training day on the Fast ForWord component to date.
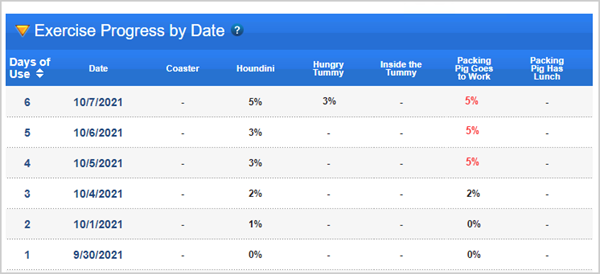
It includes the following details:
Date. This column displays the date for each day spent working on the exercises. Click the Date column header to sort the report by date. Click again to reverse the sort order.
Day. This column displays the participation day for each day spent working on the exercises.
Exercise. The columns under each exercise display the student's percent complete score for each participation day. These scores indicate the percentage of the exercise the student has successfully completed to date, and help demonstrate the student's understanding of the concepts covered in a particular exercise. Each score in this report maps directly to the Completion History graph in the Progress report, illustrating the student's progress within an exercise over time.
- A red percent complete score indicates that the student is struggling with an exercise and did not make any progress in the last 3 days.
- If the student does not work on an exercise, a percent complete score does not appear for that day.
- Each score is also a high-water mark for the exercise. For example, if a student works on 36% of an exercise, then begins to do poorly and regresses in the exercise, the percent complete score continues to reflect that 36% of the exercise has been covered.
Tip: To view the cognitive skills developed within an exercise, hold your cursor over an exercise name at the top of the column. This information facilitates a cross-exercise review that can help identify when a student is struggling with larger concepts.
Progress Details
This section provides progress details for each exercise in the Fast ForWord component to date, breaking down the information for each individual level. The last participation date appears in the header (a dash appears if the student has never worked on that exercise).
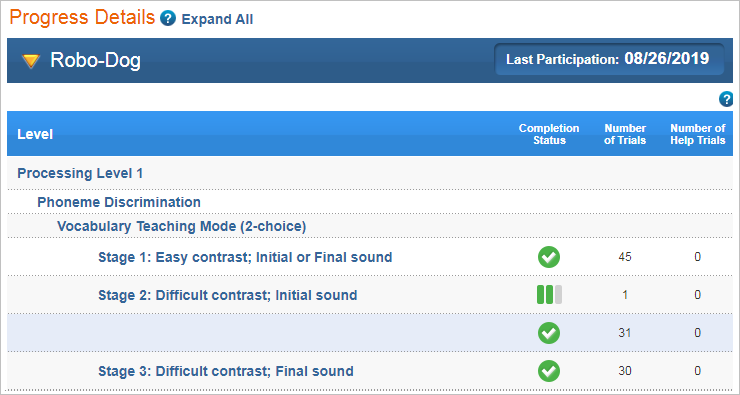
Level. Lists the levels of content in the exercise
Completion Status. Shows the following symbols to indicate progress:
![]() Not Started. The material has not been started yet.
Not Started. The material has not been started yet.
![]() In Progress. The material has been started and is currently in progress. Some exercises provide a percent complete while in progress—hold your cursor over the icon to see that percent complete score, when available.
In Progress. The material has been started and is currently in progress. Some exercises provide a percent complete while in progress—hold your cursor over the icon to see that percent complete score, when available.
![]() Goal Not Met (where applicable). Advancement criteria were not met at this pass through the material, and it may need to be repeated. New rows show repeated attempts.
Goal Not Met (where applicable). Advancement criteria were not met at this pass through the material, and it may need to be repeated. New rows show repeated attempts.
![]() Complete. The advancement criteria for the material have been met
Complete. The advancement criteria for the material have been met
Percent Correct. For some exercises, this displays the percentage of the level that was answered correctly.
Number of Trials. Displays the number of trials worked on in each level. For a few exercises, you will also see columns for the number of help trials or the number of grids, when applicable.
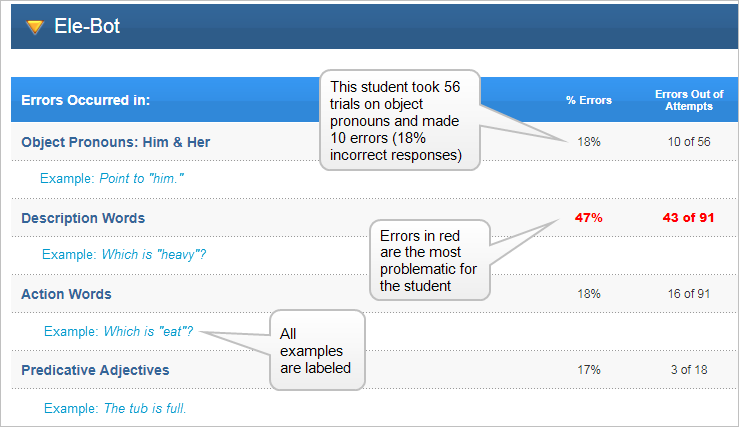
Errors
The Fast ForWord Error reports provide insight into a student's mastery of grammar, vocabulary, and word discrimination in most of the word-based exercises. Each report breaks down the errors for specific exercise content, allowing for targeted intervention strategies.
Choose from two types of error reports. The errors in each report are organized at the teachable level, to help you quickly assess the areas in which the student needs help.
- Errors – All Time. Lists errors for all days, independent of the selected date range.
- Errors – Last Participation Day. Lists errors for the last training day of each exercise, independent of the selected date range. The actual date appears in the header (a dash appears if the student has never worked on that exercise).
Errors Occurred in. Describes the content in which the student made errors. Because content often varies within a content category (grammar rules, instructions, phonemes and so on), errors are grouped by category rather than listed separately. This lets you easily identify areas of difficulty. In cases where the content description may not be familiar, examples are provided. Here, the student made an error with complex negation in Ele-Bot:
Complex Negation:
Example: The dog that is not running is big.
All examples in the Error reports are labeled. Any error without the term “example” is showing the actual content in which the error occurred.
% Errors. Shows the percentage of errors made in that content across the exercise. Higher percentages indicate the student is struggling with this content.
Errors out of Attempts. Shows the number of errors out of the number of trials taken in that content across the exercise. Larger numbers indicate the student is struggling with this content.
Errors and percentages highlighted in red are the most problematic for the student, and should be addressed:
- Only the top 5 content categories with errors are highlighted (this number may shift slightly depending on the student’s total errors)
- To make sure the errors are significant enough to need attention, the student must have made at least 3 errors in the category, and those errors must be at least 10% of the total trials taken in that category
More about error reports
mySciLEARN only provides error reports for exercises that focus on grammar, vocabulary, and word discrimination skills. For example, Foundations II only includes an error report for one exercise—Cosmic Reader, which works on these skills. For results on exercises that don’t have an error report, use the Completion Details report.
The error reports only list the content with errors. If you don't see content in the report, it means that the student did well with that content and did not make any errors, or that the student did not work on the content within the selected date range. To review all of the content in an exercise or Fast ForWord component, use the teacher manuals on Student & Teacher resources »
Printing and emailing report sections
In addition to the usual print and email options for the Progress report, mySciLEARN allows you to print and email specific sections of the report. For instructions see Print reports and Email reports.