On this page:
About the report
Each Reading Assistant Plus selection includes questions that correlate to specific comprehension strategies and skills, and help reinforce specific levels of thinking. Use this report to learn how well your students are using these strategies, skills, and levels of thinking to understand the readings. Successfully answering the comprehension questions demonstrates a clear understanding of the text. For students who are struggling with comprehension, this report can help identify areas in which the student needs more practice.
For an in-depth look at how Reading Assistant Plus teaches comprehension, along with a list of examples, see About Reading Assistant Plus comprehension.
This report shows results for students who used the component within the selected date range.
The results in this report reflect completed selections only, and only the first completion of a selection (results from any repeats are excluded). To learn more see Completing selections.
When a student works on a comprehension prompt or question, Reading Assistant Plus reveals the correct answer; therefore, the report only includes a student's first response to a prompt or question.
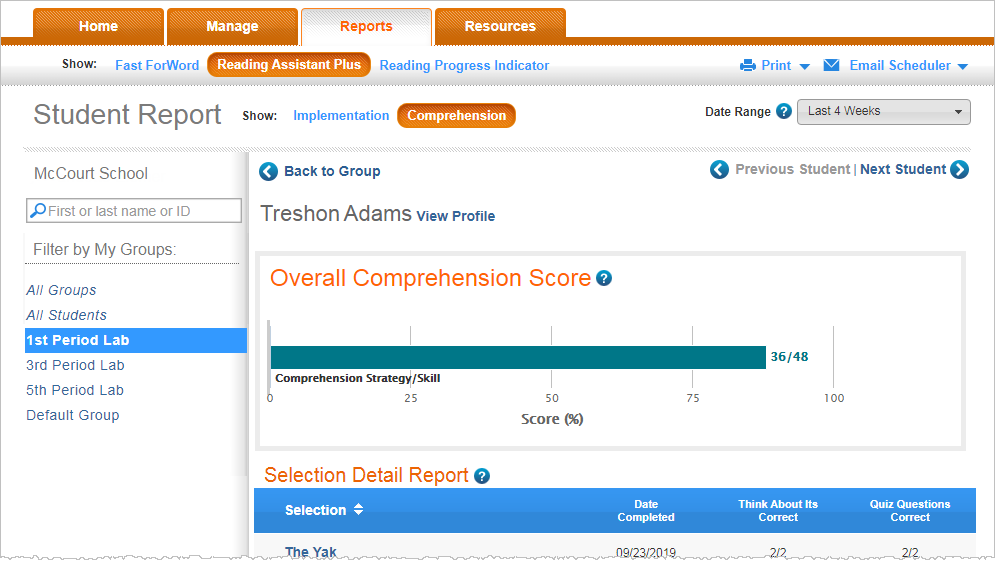
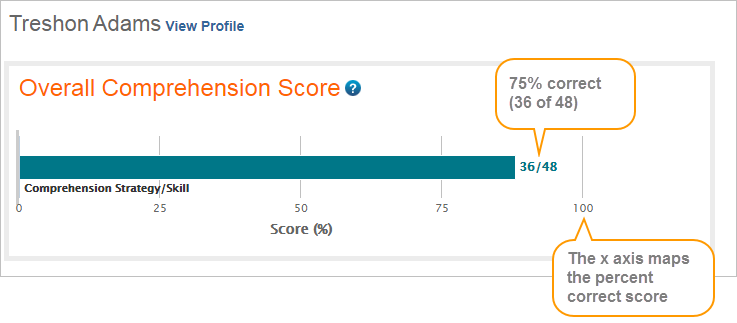
Overall Comprehension Score graph
This graph summarizes how well the student is comprehending what they read; that is, how well the student is using comprehension strategies, skills, and levels of thinking to understand the readings. To learn more see About Reading Assistant Plus comprehension.
The graph includes the Think About Its and quiz questions from the selections completed within the date range.
- The bar illustrates the percent correct score for the student (the percentage of correct responses out of total responses), which ranges from 0% to 100%.
- The number at the end of the graph shows the correct responses out of the total responses (correct/total).
- Hold your cursor over a bar to view the results in a simplified format.
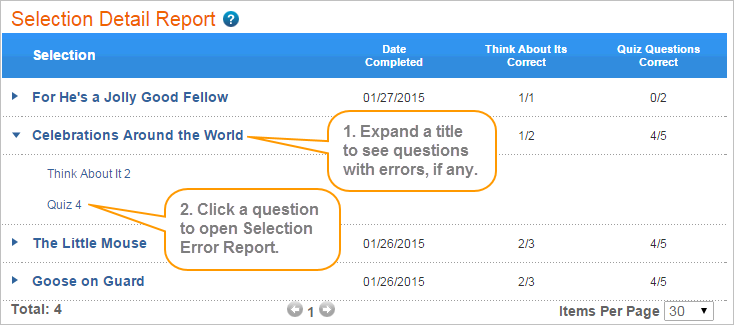
Selection Detail Report
The Selection Detail Report for the Overall Comprehension Score graph shows detailed results for the selections completed within the date range. It includes the following information, ordered by completion date:
- Selection. The title of the selection.
- Date Completed. The date that the student completed the selection.
- Think About Its Correct. The Think About Its results for the selection (correct/total responses).
- Quiz Questions Correct. The Quiz results for the selection (correct/total responses).
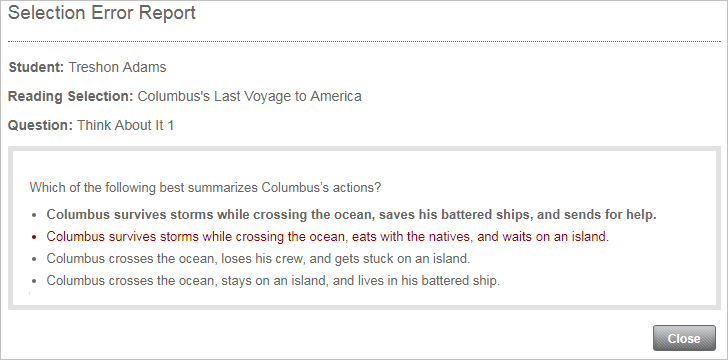
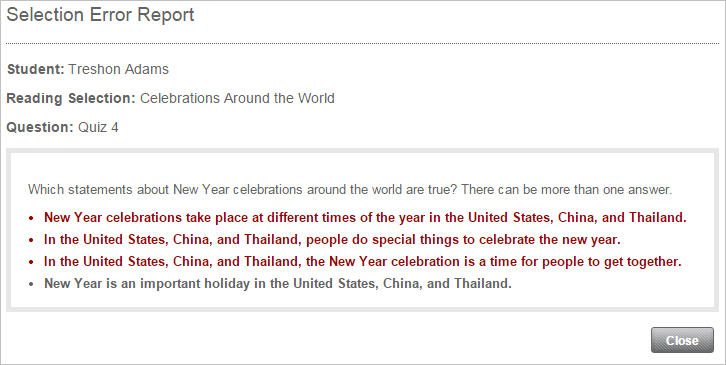
Selection Error Report
If the student has made any errors in the selections, a blue arrow appears next to the selection title in the Selection Detail Report.
- Click the arrow to expand the selection and see a list of questions that were answered incorrectly.
- Click a question to open the Selection Error Report.
The report includes the following error details:
- Student name
- Reading selection title
- Question ID; for example, Think About It 2 would be the first Think About It in the selection;Quiz 4 would be the fourth quiz question in the selection
- The actual question or prompt, with a list of all possible responses. Each response is color coded as follows:
- Incorrect response (red)
- Correct response (bold)
- Unchosen response (normal)
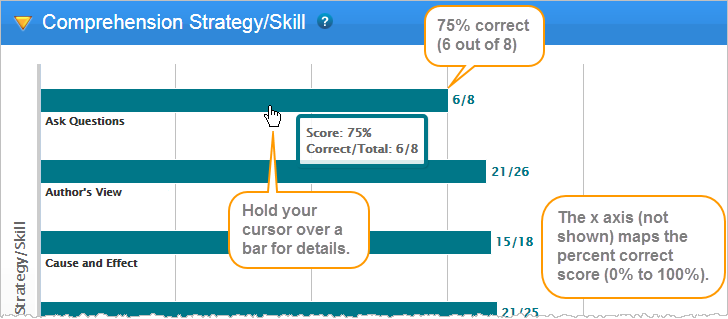
Comprehension Strategy/Skill graph
When you first open the Student Comprehension report, the Strategy/Skill section is collapsed. Click the arrow to expand it and see comprehension strategy and skill results for your student.
Because individual comprehension strategies and skills are measured across multiple selections, it may take some time before you start to see patterns emerge. For example, Retell/Summarize strategy questions may only appear in one out of every three or four selections, which means you may need to wait for the student to read six or more selections before you'll be able to tell if the student has a problem with that strategy or skill.
The Comprehension Strategy/Skill graph illustrates the student's proficiency in using the individual comprehension strategies and skills to understand text. Students mostly practice comprehension strategies using the Think About Its in the Preview and Read on My Own activity, and comprehension skills during the Take the Quiz activity. To learn more see About Reading Assistant Plus comprehension.
- Each bar illustrates the percent correct score for a strategy/skill (the percentage of correct responses out of total responses), which ranges from 0% to 100%.
- The number at the end of the graph shows the correct responses out of the total responses for that strategy/skill (correct/total).
- Hold your cursor over a bar to view the results in a simplified format.
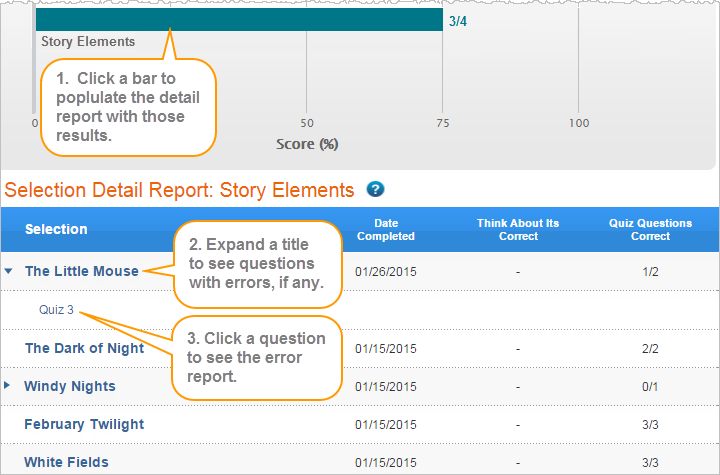
Selection Detail Report
This report lets you view detailed results from the Strategy/Skill graph, organized by individual comprehension strategy or skill.
When you first open the Strategy/Skill graph, the report is empty. Click a bar in the graph to populate the report with results for that strategy or skill. If an item has only a few results, it may not show a bar. In this case, click the strategy/skill to populate the report. It includes the following information, ordered by completion date:
- Selection. The title of the selection.
- Date Completed. The date that the student completed the selection.
- Think About Its Correct. The Think About Its results for the selection (correct/total responses).
- Quiz Questions Correct. The Quiz results for the selection (correct/total responses).
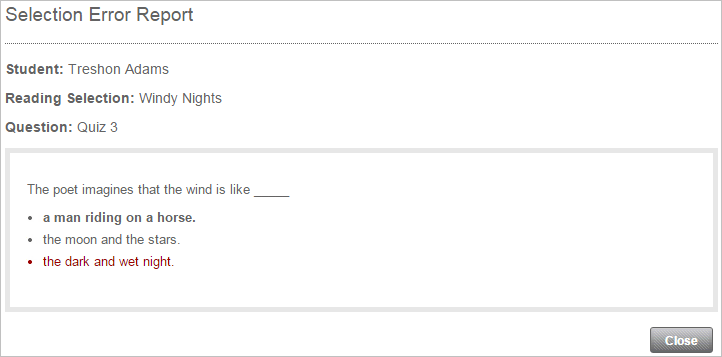
Selection Error Report
If the student has made any errors in the selections, a blue arrow appears next to the selection title in the Selection Detail Report.
- Click the arrow to expand the selection and see a list of questions that were answered incorrectly.
- Click a question to open the Selection Error Report.
The report includes the following error details:
- Student name
- Reading selection title
- Question ID; for example, Quiz 3 would be the third quiz question in the selection
- The actual question or prompt, with a list of all possible responses. Each response is color coded:
- Incorrect response (red)
- Correct response (bold)
- Unchosen response (normal)
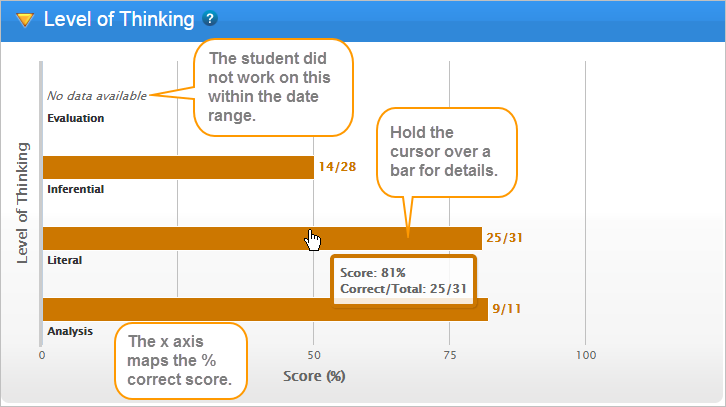
Level of Thinking graph
When you first open the Student Comprehension report, the Level of Thinking section is collapsed. Click the yellow arrow to expand it and see results for the student.
Because individual levels of thinking are measured across multiple selections, it may take some time before you start to see patterns emerge. For example, Evaluation level of thinking questions may only appear in one out of every three or four selections, which means you may need to wait for the student to read six or more selections before you'll be able to tell if the student has a problem with that level of thinking.
The Level of Thinking graph organizes the results for the student into four horizontal bar graphs—one for each level of thinking. To learn more see About Reading Assistant Plus comprehension.
- Each bar illustrates the percent correct score for a level of thinking (the percentage of correct responses out of total responses), which ranges from 0% to 100%.
- The number at the end of the graph shows the correct responses out of the total responses for that level of thinking (correct/total).
- Hold your cursor over a bar to view the results in a simplified format.
Selection Detail Report
This report lets you view detailed results by individual level of thinking.
When you first open the Level of Thinking graph, the report is empty. Click a bar in the graph to populate the report with results for that level of thinking. If an item has only a few results, it may not show a bar. In this case, click the level of thinking to populate the report. It includes the following information, ordered by completion date:
- Selection. The title of the selection.
- Date Completed. The date that the student completed the selection.
- Think About Its Correct. The Think About Its results for the selection (correct/total responses).
- Quiz Questions Correct. The Quiz results for the selection (correct/total responses).
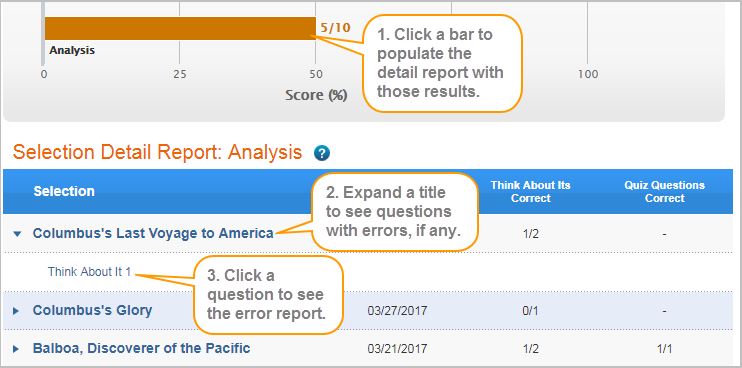
Selection Error Report
If the student has made any errors in the selections, a blue arrow appears next to the selection title in the Selection Detail Report.
- Click the arrow to expand the selection and see a list of questions that were answered incorrectly.
- Click a question to open the Selection Error Report.
The report includes the following error details:
- Student name
- Reading selection title
- Question ID; for example, Think About It 1 would be the first Think About It in the selection
- The actual question or prompt, with a list of all possible responses. Each is color coded:
- Incorrect response (red)
- Correct response (bold)
- Unchosen response (normal)