On this page:
About the report
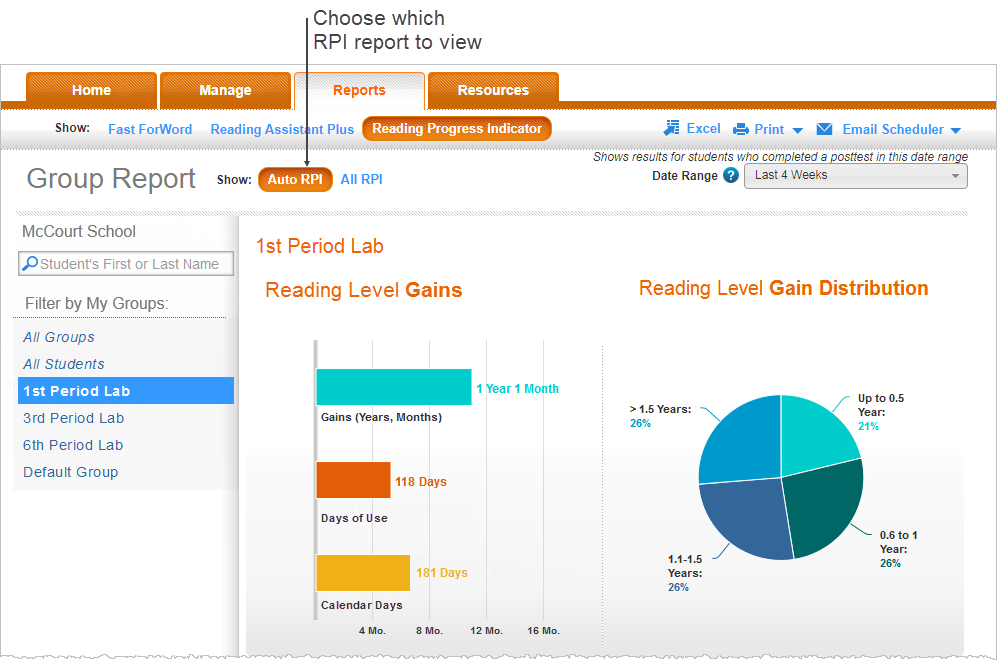
Use this report to review gains for your groups, as measured by Reading Progress Indicator (RPI), our integrated assessment tool. RPI assessments help measure the impact of Fast ForWord intervention. To learn about the assessments in this report see About Reading Progress Indicator (RPI).
When using assessments to evaluate students, it's important to note that assessment scores only represent a partial snapshot of a student's performance at a given time, which can be influenced by the student's psychological or physical state at the time of testing. As such, assessment tools can be subject to errors. Scientific Learning recommends using both a pattern of test performance over time and multiple assessment tools to provide a more accurate measure of a student's true performance.
Additionally, please note that an assessment is considered to be at or below chance if the student scored below 30% on the assessment. Assessment scores below 30% correct cannot be distinguished from random guessing, and therefore are not a good basis for a valid evaluation. When reviewing RPI scores for your students, consider whether unexpectedly low scores seem reasonable for those students. If not, you may choose to void the RPI assessment and have the student complete a new assessment.
See RPI assessments for information on managing RPI assessments for your students. The Reading Progress Indicator FAQ is also a great resource, providing answers to frequently asked questions about RPI, scoring, and other important facts.
Based on which RPI report you’re viewing, the report includes the following assessments:
- The RPI Auto report only uses assessments administered by the Auto RPI feature. This includes initial assessments for any component (Fast ForWord and Reading Assistant Plus), and follow-up assessments for the Fast ForWord components. To calculate results, the report compares the students’ initial assessments to the latest follow-up assessments completed within the selected date range. The initial assessments may be outside the date range, but the follow-up assessments must be within the date range or the gains results for those student will not be included. If none of the students have completed a follow-up assessment within the date range, no results will appear in the report.
- The RPI All report uses assessments administered for any component—Fast ForWord or Reading Assistant Plus. To calculate results, the report uses the first and last assessments completed within the selected date range. If none of the students have completed at least two assessments within the date range, no results will appear in the report.
If you don’t see results in the report, your students may not have completed the required assessments within the selected date range. Try changing the date range, or wait until the students have completed their next assessment.
To learn how Reading Progress Indicator assesses gains throughout the report, see About RPI gains results.
Reading Level Gains graph
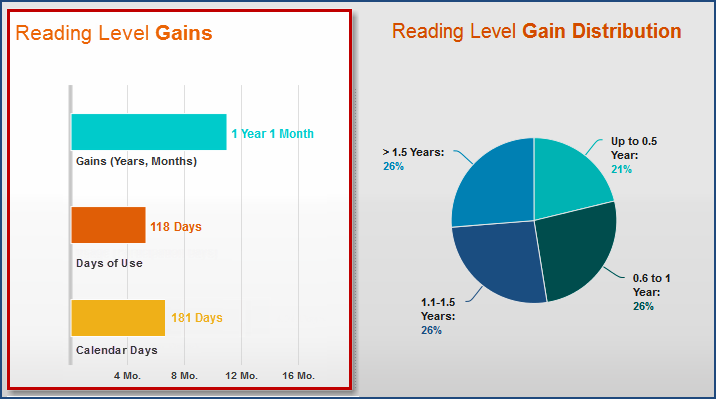
This bar graph displays the average reading level gain score for your students compared to the length of time they spent using the Fast ForWord product, as measured between each student's assessments. It appears next to the Reading Level Gain Distribution graph to let you also see the distribution of actual student scores across four gains levels.
To view the number of students measured in this graph, hold your cursor over a bar.
![]() Gains. This bar represents the average reading level gain score for your students after Fast ForWord product use. mySciLEARN calculates this score by subtracting the average reading level on the initial assessments from the average reading level on the follow-up assessments. A numerical gain score appears at the end of the bar, in years and months. To learn more see Gain scores.
Gains. This bar represents the average reading level gain score for your students after Fast ForWord product use. mySciLEARN calculates this score by subtracting the average reading level on the initial assessments from the average reading level on the follow-up assessments. A numerical gain score appears at the end of the bar, in years and months. To learn more see Gain scores.
![]() Days of Use. This bar represents the average number of days the students worked on the Fast ForWord product, as measured between the assessments. This number is generally lower than the number of calendar days due to weekends, holidays, and absences. The actual number of participation days appears at the end of the bar.
Days of Use. This bar represents the average number of days the students worked on the Fast ForWord product, as measured between the assessments. This number is generally lower than the number of calendar days due to weekends, holidays, and absences. The actual number of participation days appears at the end of the bar.
![]() Calendar Days. This bar represents the average number of calendar days that have elapsed since the students first started the Fast ForWord product, as measured between the assessments. The actual number of calendar days appears at the end of the bar.
Calendar Days. This bar represents the average number of calendar days that have elapsed since the students first started the Fast ForWord product, as measured between the assessments. The actual number of calendar days appears at the end of the bar.
In the gains reports, reading level gain scores are the same as grade equivalent gain scores.
Reading Level Gain Distribution graph
This graph maps your students across four categories of reading level gain scores, as measured between each student's assessments. It appears next to the Reading Level Gains graph to let you also see the average reading level gain score for the school.
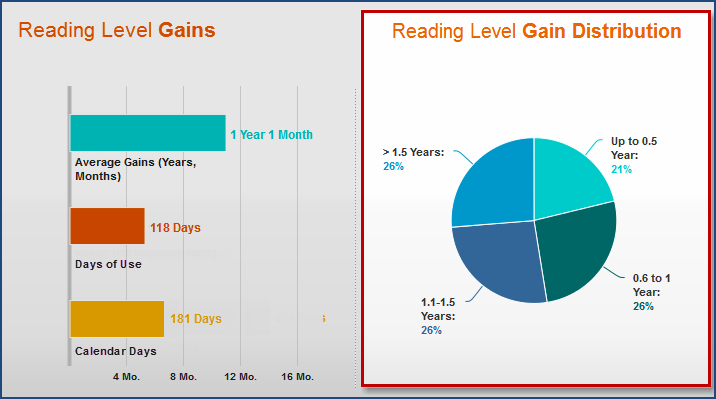
Each student with a gain score appears in one of the following four categories. Each category also displays the percentage of students who fall in that category. To view the actual number of students in each category, hold your cursor over that category. To learn more see Gain scores.
![]() Up to 0.5 Year (cyan)
Up to 0.5 Year (cyan)
![]() 0.6 to 1.0 Year (green)
0.6 to 1.0 Year (green)
![]() 1.1 to 1.5 Years (dark blue)
1.1 to 1.5 Years (dark blue)
![]() Greater than 1.5 Years (light blue)
Greater than 1.5 Years (light blue)
In the gains reports, reading level gain scores are the same as grade equivalent gain scores.
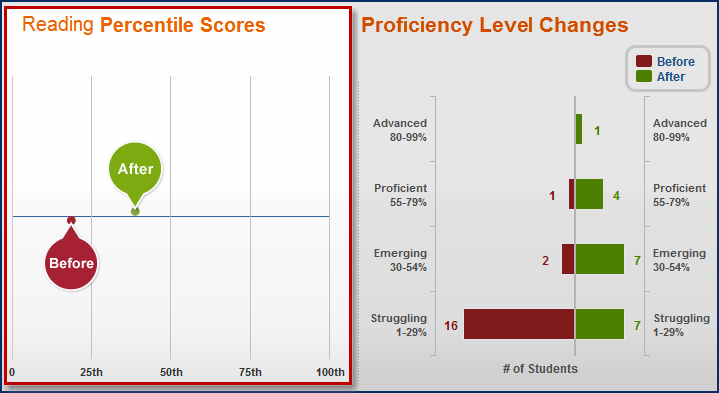
Reading Percentile Scores graph
This graph presents the average reading level percentile scores before and after Fast ForWord product use, as measured by each student's assessments. This score reflects your students' performance compared to students across the nation. It appears next to the Proficiency Level Changes graph to let you also see the distribution of the students by reading proficiency level.
To learn more about percentiles see National percentile scores.
![]() Before (red). The average national percentile score before Fast ForWord product use, as measured by the initial assessments.
Before (red). The average national percentile score before Fast ForWord product use, as measured by the initial assessments.
![]() After (green). The average national percentile score after Fast ForWord product use, as measured by the follow-up assessments.
After (green). The average national percentile score after Fast ForWord product use, as measured by the follow-up assessments.
Proficiency Level Changes graph
This graph maps your students across four proficiency levels—both before and after Fast ForWord product use—to illustrate improvements in reading proficiency level. It appears next to the Reading Percentiles score graph to let you also see the average percentile scores for the school before and after Fast ForWord product use.
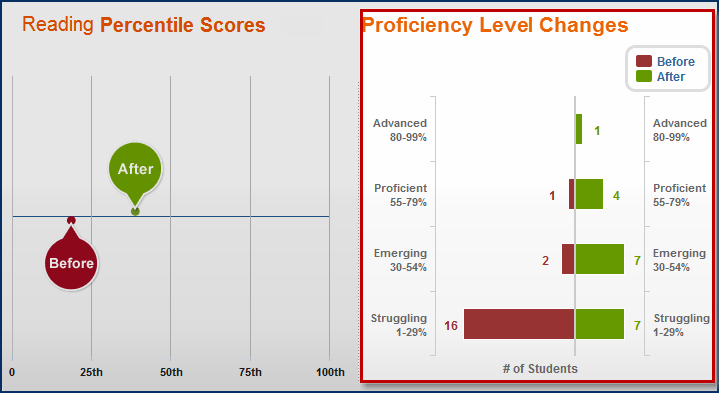
The left side of the graph (red) maps the proficiency levels on the initial assessments and the right side of the graph (green) maps the proficiency levels on the latest follow-up assessments completed within the date range. Proficiency levels are based on percentile scores and reflect how each student compares with his or her peers across the nation. Each bar in the graph also displays the number of students whose scores fall in that proficiency level. Note that students can make dramatic gains without changing performance levels; for example, a student could move from the 55th percentile to the 75th percentile but still be within the Proficient level. To learn more see Reading proficiency levels.
- Struggling – 1st to 29th percentile
- Emerging – 30th to 54th percentile
- Proficient – 55th to 79th percentile
- Advanced – 80th to 99th percentile
By default, the graph includes all information. You can choose which data to include in the graph by clicking that item (in blue) in the legend at the top right of the graph.
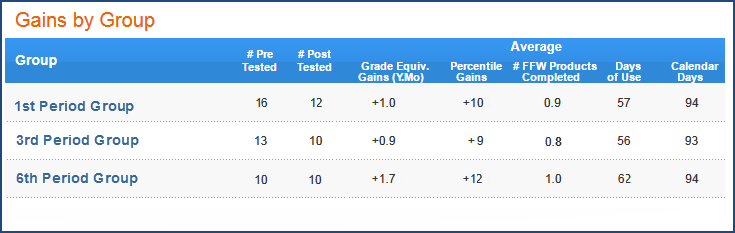
Gains by Group table (all groups)
When viewing all groups, this appears at the bottom of the report and presents gains results for each of your groups, as measured between each student's assessments. It lets you easily compare gains results across your groups. It includes the following assessments, based on your view:
- RPI (Auto) includes each student’s initial assessment completed within the date range, including those taken for Reading Assistant placement (Reading Assistant only), and all follow-up assessments completed within the date range. If a student's follow-up assessment is included in the report, the student's initial assessment is also included, even it was completed outside the date range. This lets you can compare results between the two assessments.
- RPI (All) includes the first and last assessments completed within the date range.
The table includes the following columns. To sort the table, click the Group column header.
Group. The groups in which students have taken an initial assessment or follow-up assessment within the date range, including any initial assessments completed by students using Reading Assistant Plus. Click a group name to view results for that single group.
Pre Tested. The number of students in the group who have taken an assessment (initial or follow-up) within the date range, including any initial assessments completed by students using Reading Assistant Plus.
Post Tested. The number of students in the group who have taken a follow-up assessment within the date range.
Grade Equivalent Gains (Y.Mo). The average RPI grade equivalent gain score (or reading level gain score) after Fast ForWord product use. The first digit in this score represents the number of years gained and the second digit represents the number of months gained. The grade equivalent score is based on an academic school year of ten months, so a score of 2.4 represents a gain of two academic years and four months. To learn more see Gain scores.
Percentile Gains. The average reading level percentile gains after Fast ForWord product use. To learn more see National percentile scores.
The last three columns show results for the Fast ForWord components.
- FFW Products Completed. The average number of Fast ForWord components completed to date; that is, components in which the students earned a Switch or Complete status. To learn more see About report status updates and alerts.
- Days of Use. The average number of days that the students used (but not necessarily completed) the Fast ForWord components, as measured between the assessments. This number is generally lower than the number of calendar days due to weekends, holidays, and absences.
- Calendar Days. The average number of calendar days that have elapsed since the students first started the Fast ForWord components, as measured between the assessments.
Tip: If a group does not have any students with a follow-up assessment in the date range, no gains results will appear in the table—only the Group and # Pre Tested columns will show information. For these groups, if you click the group name to view the single group and student reports, you may need to change the date range to see results. To learn more see About report date ranges.
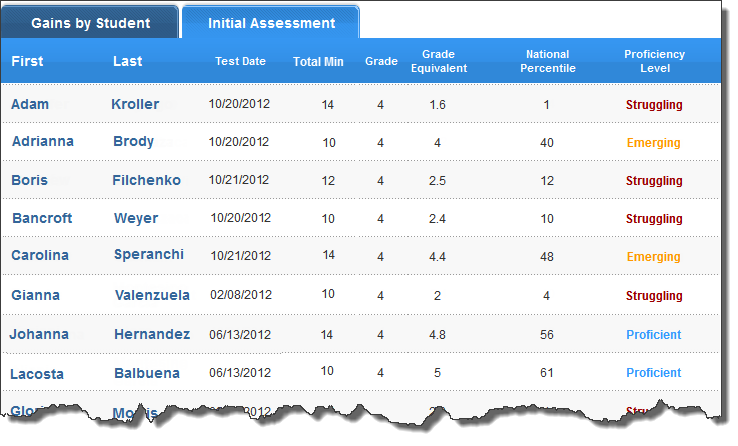
Initial Assessment table (single group)
Before using the Fast ForWord product, each student completes an RPI assessment to measure his or her reading skill level. When viewing results for a single group, this table illustrates the initial assessment results for the students in the group, allowing you to easily compare assessment results across those students. It includes the following assessments, based on your view:
- RPI (Auto) includes each student’s initial assessment completed within the date range, including those taken for Reading Assistant placement (Reading Assistant only). This lets you can compare results with the Gains by Student table.
- RPI (All) includes the first assessments completed within the date range.
The table includes the following columns. To sort the table, click the First or Last name column header.
First/Last. The first and last names of the students in the group who have taken assessments, including any initial assessments completed by students using Reading Assistant Plus. Click a student's first or last name to access the gains report for that student. See Student Report – Reading Progress Indicator for details. When exporting the report, this table also includes student IDs for each student in the report. To learn about student IDs see Required student information. To learn about exporting reports see Export reports (Excel).
Test Date. The date that the student took the initial assessment.
Total Min. Time spent taking the assessment, rounded to the nearest minute.
Grade. The student's grade when he or she took the initial assessment.
Grade Equivalent (Y.Mo). The student's RPI grade equivalent before using the Fast ForWord product. This score reflects the student's performance compared to the average student at a given grade level. The first digit in this score represents the year and the second digit represents the month. The grade equivalent score is based on an academic school year of ten months, so a student with a score of 2.4 is performing on par with an average student in the fourth month of the second grade. To learn more see Grade equivalent scores.
National Percentile. The student's reading level percentile before using the Fast ForWord product. To learn more see National percentile scores.
Proficiency Level. Proficiency levels are based on percentile scores and can reflect how each student compares with his or her peers across the nation. Note that students can make dramatic gains without changing performance levels; for example, a student could move from the 55th percentile to the 75th percentile but still be within the Proficient level. To learn more see Reading proficiency levels.
- Struggling (red) – 1st to 29th percentile
- Emerging (yellow) – 30th to 54th percentile
- Proficient (blue) – 55th to 79th percentile
- Advanced (green) – 80th to 99th percentile
This table may include more results than the Gains by Student table, because some students may not have taken a follow-up assessment yet, or may not have taken one within the date range.
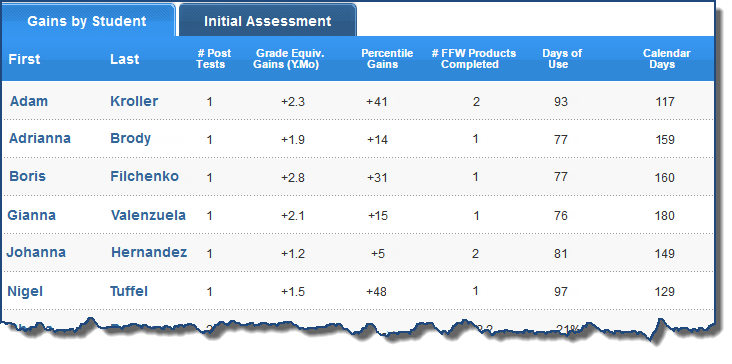
Gains by Student table (single group)
After using the Fast ForWord product, each student completes another RPI assessment to measure the impact of Fast ForWord product use. When viewing results for a single group, this table illustrates the gains results for the students in that group, as measured between each student's assessments.
To sort the table, click the First or Last name column header.
First/Last. The first and last names of the students in the group. Click a student's first or last name to access the student gains report for that student. See Student Report – Reading Progress Indicator for details. Note that if a student appears in this table, that student will also appear in the Initial Assessment table (single group) so you can easily compare the results between the two assessments. When exporting the report, this table also includes student IDs for each student in the report. To learn about student IDs see Required student information. To learn about exporting reports see Export reports (Excel).
Post Tests. The number of follow-up assessments taken by the student.
Days of Use. The number of days that the student used the Fast ForWord product, as measured between the assessments. This number is generally lower than the number of calendar days due to weekends, holidays, and absences.
Calendar Days. The average number of calendar days that have elapsed since the students first started the Fast ForWord product, as measured between the assessments.
Grade Equivalent Gains (Y.Mo). The student's RPI grade equivalent gain after using the Fast ForWord product. Grade equivalent scores reflect the student's performance compared to the average student at a given grade level. This gain score shows the difference between the student's initial and latest test scores. The first digit in this score represents the number of years gained and the second digit represents the number of months gained. The grade equivalent score is based on an academic school year of ten months, so a score of 2.4 represents a gain of two academic years and four months. To learn more see Gain scores.
Percentile Gains. The student's reading level percentile gain after using the Fast ForWord product. To learn more see National percentile scores.
FFW Products Completed. The number of Fast ForWord components completed by the student to date; that is, components in which the student earned a Switch or Complete status. To learn more see About report status updates and alerts.
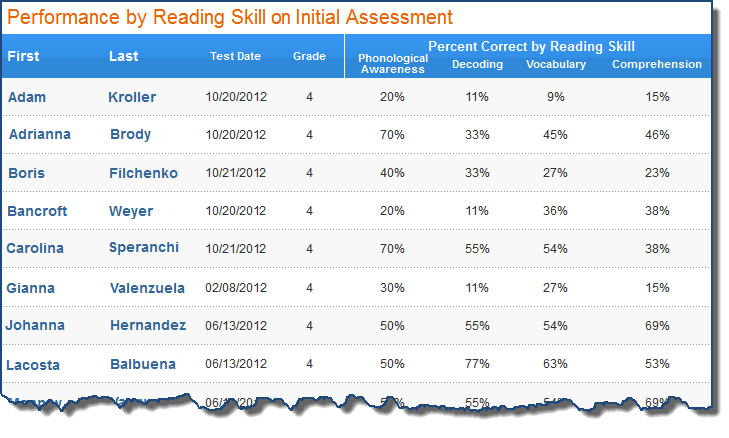
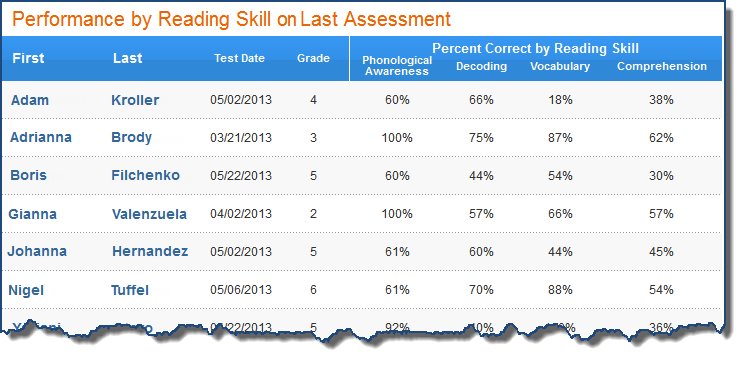
Performance by Reading Skill table (single group)
The Performance by Reading Skill table presents reading skill results for the students in your group, as measured by the RPI assessments from the table you're viewing: Initial Assessment table (single group) or Gains by Student table (single group). It lets you easily compare reading skill results across students, either before or after Fast ForWord product use.
The table includes the following columns. To sort the table, click the First or Last name column header.
First/Last. The first and last names of the students from the Initial Assessments table or the Gains by Student table, depending on which table you're currently viewing. To see students from the other table, click the corresponding tab. When exporting the report, this table also includes student IDs for each student in the report. To learn about student IDs see Required student information. To learn about exporting reports see Export reports (Excel).
Test Date. The date that the student completed the assessment.
Grade. The student's grade when he or she completed the assessment.
Percent Correct by Reading Skill. This section shows the percent correct scores (that is, the percentage of correct answers out of total answers) for the skills tested within the assessment. These scores help illustrate a student's skills at the time the assessment was taken.
- Phonological awareness. The ability to discriminate, identify, and manipulate the sounds in words; for example, recognizing that ball and tall are words that rhyme, or removing the first sound of cat to make the word at.
- Decoding. The ability to decipher written words. Decoding requires phonological awareness as well as an understanding of sound-symbol correspondences.
- Vocabulary. The ability to understand a word's meaning and syntactical role, and to recognize the individual morphemes in a word. Morphemes are the smallest unit of meaning in a language and include roots, prefixes, and suffixes.
- Comprehension. The ability to read text (or listen to spoken language) and actively construct meaning so as to understand the author’s message.