On this page:
About the report
Use this report to learn how well your students are meeting the weekly usage goals for the Fast ForWord components. Students who consistently earn high implementation ratings and meet usage goals typically gain the most benefit from the Scientific Learning components. The achievement scores—completion rate, attendance, and participation—measure implementation by comparing actual achievement against achievement goals. The implementation score allows teachers to easily compare implementations across the students in their groups.
This report shows results for students who used the component within the selected date range. See the Usage Averages for the number of students included.
Throughout the report, mySciLEARN uses specific formulas to calculate and rate the weekly achievement and implementation scores for a student. To learn more see About Fast ForWord report scores.
When calculating the scores across more than one week, mySciLEARN averages the scores across the total weeks in the date range. For example, if the date range is Last 4 Weeks, mySciLEARN shows an average of the scores for the last four weeks. See About report date ranges for more information on date ranges.
Usage graph
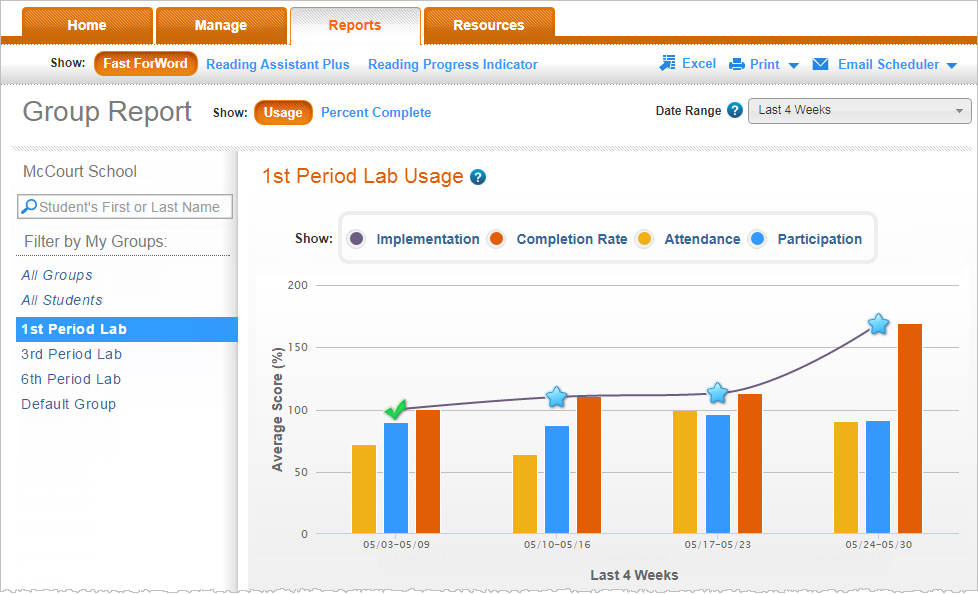
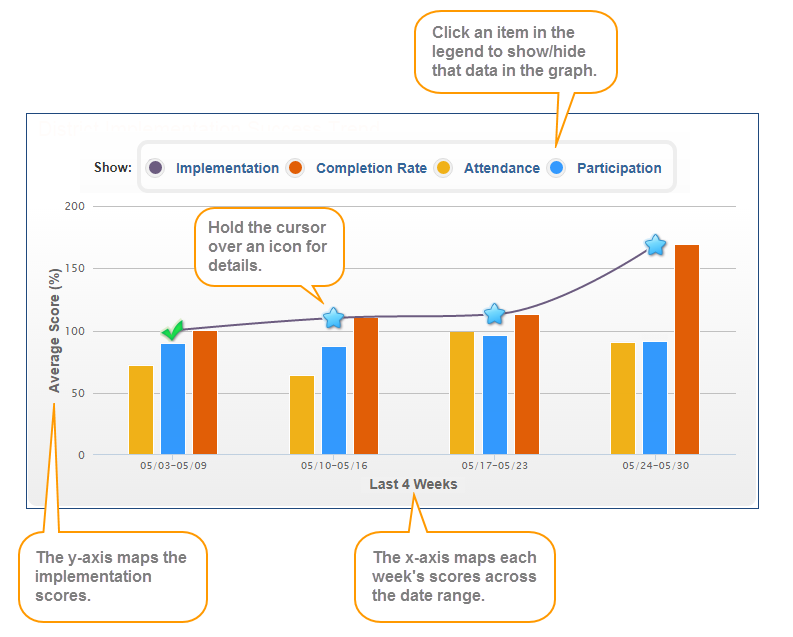
This graph illustrates how well your students are meeting the weekly achievement and usage goals across the selected date range. It averages the student scores, compares those averages to weekly goals, and then rates those scores. The x-axis maps each week in the date range, and the y-axis maps the scores.
The graph maps the following implementation score averages for each week in the date range:
![]() Implementation. This line graph provides a quick overview of implementation success. Each score includes an icon to indicate its rating:
Implementation. This line graph provides a quick overview of implementation success. Each score includes an icon to indicate its rating: ![]() Above Target,
Above Target, ![]() On Target,
On Target, ![]() Approaching Target,
Approaching Target, ![]() Below Target. To view details, hold your cursor over an icon. For more about this score see Implementation. For a thorough understanding of implementation success, check all three scores: completion rate, attendance, and participation.
Below Target. To view details, hold your cursor over an icon. For more about this score see Implementation. For a thorough understanding of implementation success, check all three scores: completion rate, attendance, and participation.
![]() Completion Rate. This orange bar graph shows how quickly the students progressed through the component when they used it, relative to their expected completion rate. For more about this score see Completion rate.
Completion Rate. This orange bar graph shows how quickly the students progressed through the component when they used it, relative to their expected completion rate. For more about this score see Completion rate.
![]() Attendance. This yellow bar graph shows how many days per week the students used the component, relative to their scheduled days per week. For more about this score see Attendance.
Attendance. This yellow bar graph shows how many days per week the students used the component, relative to their scheduled days per week. For more about this score see Attendance.
![]() Participation. This blue bar graph shows how much time the students spent using the component, relative to their scheduled minutes per day.For more about this score see Participation.
Participation. This blue bar graph shows how much time the students spent using the component, relative to their scheduled minutes per day.For more about this score see Participation.
Usage Averages
This chart provides an overall summary of how well the students in your group are meeting the weekly achievement and implementation goals. It averages the student scores, compares those averages to weekly goals, and then rates those scores.
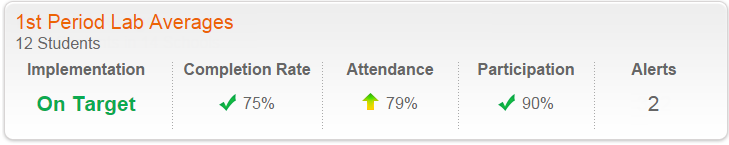
# Students. The number of students in the group who used the component within the selected date range. These are the students included in the report.
Implementation. This rating provides a quick overview of implementation success: Above Target (blue), On Target (green), Approaching Target (yellow), or Below Target (orange). For more about this score see Implementation. For a thorough understanding of implementation success, check all three scores: completion rate, attendance, and participation.
Completion Rate. How quickly the students progressed through the component when they used it, relative to their expected completion rate. An icon indicates the score's rating: ![]() Above Target,
Above Target, ![]() On Target,
On Target, ![]() Approaching Target,
Approaching Target, ![]() Below Target. For more about this score see Completion rate.
Below Target. For more about this score see Completion rate.
Attendance. How many days per week the students used the component, relative to their scheduled days per week. An icon indicates the score's rating: ![]() On Target,
On Target, ![]() Approaching Target,
Approaching Target, ![]() Below Target. For more about this score see Attendance.
Below Target. For more about this score see Attendance.
Participation. How much time the students spent using the component, relative to their scheduled minutes per day. An icon indicates the score's rating: ![]() On Target,
On Target, ![]() Approaching Target,
Approaching Target, ![]() Below Target. For more about this score see Participation.
Below Target. For more about this score see Participation.
Alerts. The number of current intervention alerts for the students. An intervention alert indicates that a student requires immediate attention. To learn more see About report status updates and alerts. Intervention alert details appear in the Usage by Student table section of this report, in the Status field. Alerts are date sensitive, so you may see "N/A" in this field if your date range does not include the current date.
Usage by Student table
When viewing a single group, this table provides implementation details for the students in the group who used the component within the selected date range. When viewing all groups, this table provides implementation scores and ratings for the groups that used the Fast ForWord components within the selected date range (not shown).
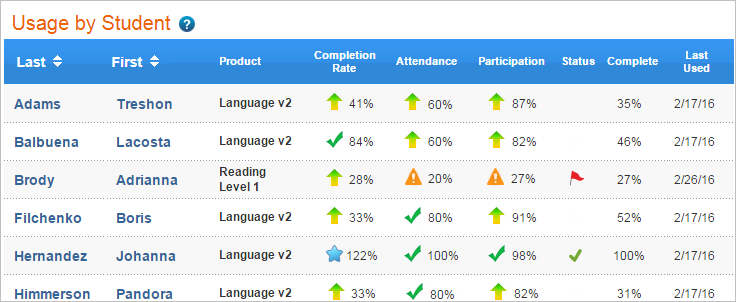
The table includes the following information. Click a column header to sort the report.
Last/First. The first names and last names of all students in the group who used the component within the selected date range. Click a student's first name or last name to access the Progress report for that student. When exporting the report, this table also includes student IDs for each student in the report. To learn about student IDs see Required student information. To learn about exporting reports see Export reports (Excel).
Product. The Fast ForWord component used by the student.
Completion Rate. How quickly the student progressed through the component when he/she used it, relative to the expected completion rate. An icon indicates the score's rating: ![]() Above Target,
Above Target, ![]() On Target,
On Target, ![]() Approaching Target,
Approaching Target, ![]() Below Target. For more about this score see Completion rate.
Below Target. For more about this score see Completion rate.
Attendance. How many days per week the student used the component, relative to the scheduled days per week. An icon indicates the score's rating: ![]() On Target,
On Target, ![]() Approaching Target,
Approaching Target, ![]() Below Target. For more about this score see Attendance.
Below Target. For more about this score see Attendance.
Participation. How much time the student spent using the component, relative to the scheduled minutes per day. An icon indicates the score's rating: ![]() On Target,
On Target, ![]() Approaching Target,
Approaching Target, ![]() Below Target. For more about this score see Participation.
Below Target. For more about this score see Participation.
Status. Any current status updates and alerts for a student. An intervention alert indicates that the student requires immediate attention. If you see a status update or alert icon in this column, click it for detailed recommendations. To learn more see About report status updates and alerts. Status updates and alerts are date sensitive, so this field may be blank if your date range does not include the current date.
![]() Switch
Switch
![]() Complete
Complete
![]() Intervene
Intervene
![]() Adjust
Adjust
Complete. The percentage of the component that the student has successfully completed to date. This score helps illustrate a student's understanding of the concepts covered in a particular component. See more details for a student on the Progress report.
Last Used. The last date in the date range that the student used the component.